
Ethereum Posts Best Q3 Since 2016, But $2,500 Holds the Answer
A Quarter That Stood Out
Ethereum closed its third quarter of 2024 with a performance that, by historical measure, was the strongest Q3 the asset has recorded since 2016. That kind of benchmark doesn’t appear often, and it arrived while broader crypto markets were grinding through an uncertain macro environment. Price action in ETH throughout the quarter reflected a network that was absorbing both institutional attention and retail skepticism at the same time – neither group fully in control.
The single question that now defines ETH’s short-term trajectory is whether $2,500 becomes a floor or remains a ceiling.
Bears have repeatedly used the $2,500 level to cap recovery attempts, flipping what bulls hoped would become a launching pad into one of the more stubborn resistance zones in recent ETH history. Whether that dynamic reverses – and what it would take to make it reverse – sits at the center of every serious technical argument being made about Ethereum right now. The quarter’s performance gives bulls a historical data point to anchor their case, but history doesn’t automatically translate into near-term price structure.

What the Q3 Record Actually Means
When analysts call this Ethereum’s best Q3 since 2016, the reference point matters. In 2016, ETH was a different asset in almost every practical sense – smaller market cap, thinner liquidity, a fraction of the developer ecosystem it has today. Matching or surpassing that quarter’s performance in 2024, within a market where ETH is a top-two asset by capitalization and is traded on regulated derivatives exchanges globally, is a structurally different achievement. The comparison flatters ETH on absolute terms, but it also highlights how early the network still was when that prior record was set.
The Q3 performance didn’t arrive without complications. ETH has lagged Bitcoin on a year-to-date basis through multiple stretches of 2024, a pattern that frustrated holders who had anticipated the spot Ethereum ETF approvals in the United States would drive a sustained price breakout. Those ETF products launched and attracted inflows, but the price response was muted relative to what Bitcoin experienced following its own spot ETF debut in January 2024. That gap between narrative expectation and actual price movement is part of why $2,500 carries so much psychological weight – it’s the level where the post-ETF momentum stalled and selling pressure reasserted itself.
Still, closing Q3 as the best in eight years puts a concrete number behind the bullish argument. The quarter didn’t just hold ground – it built a case that ETH’s underlying demand profile is stronger than its underperformance against Bitcoin in certain windows might suggest. Network activity, staking participation, and layer-2 ecosystem growth all contributed to a period that, on balance, ended in ETH’s favor.
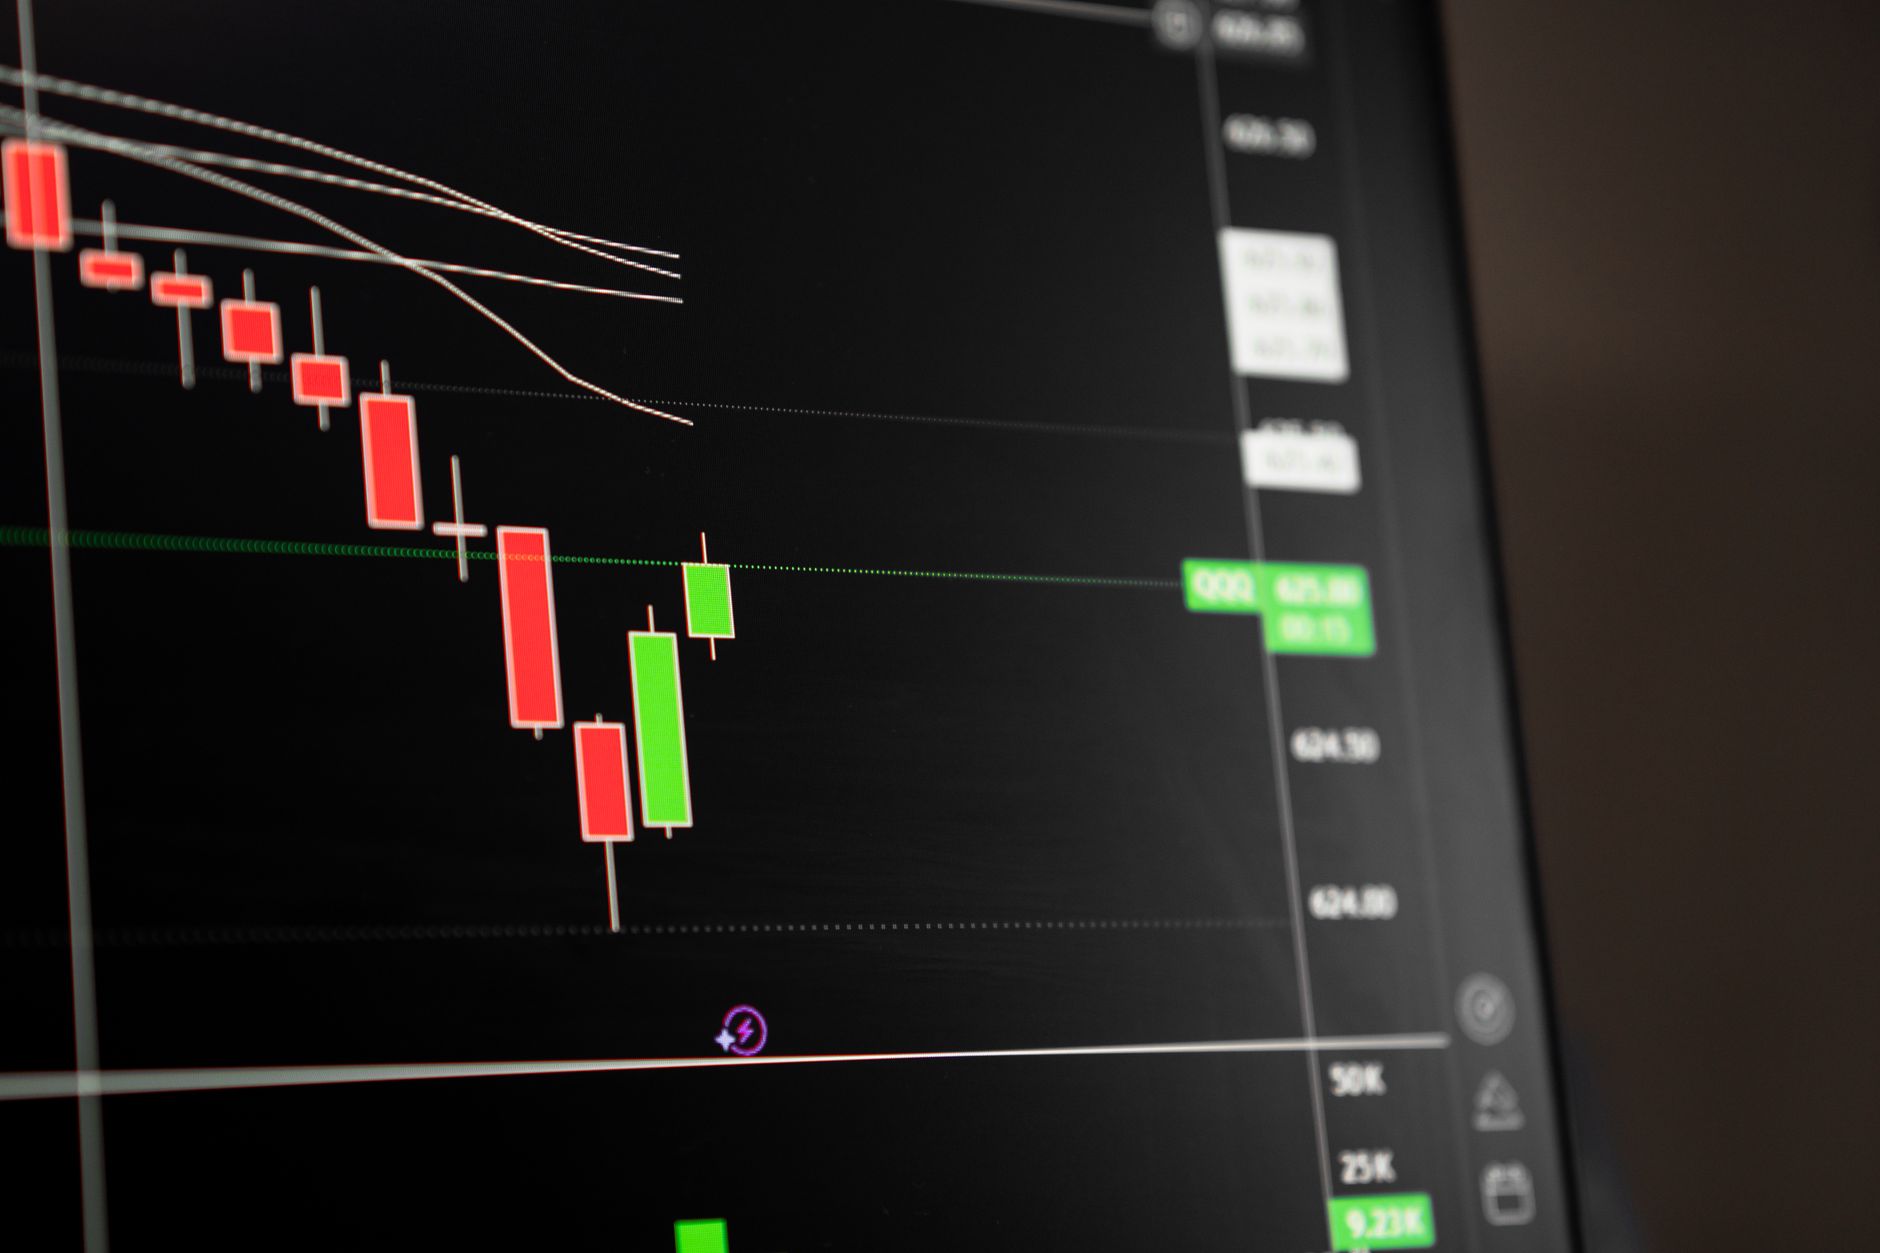
The $2,500 Level and What Bears Keep Doing With It
Price levels acquire meaning through repetition. Every time ETH has approached $2,500 from below in recent months, sellers have emerged with enough conviction to push it back down, and that repeated behavior has turned a round number into something more technically significant. A level that gets tested and rejected multiple times isn’t just resistance – it becomes the market’s stated position on where fair value ends and overvaluation begins, at least in the short run.
For bulls, flipping $2,500 into support requires more than a brief break above it. It requires sustained buying at or just above that price, meaning buyers who previously waited for dips would need to defend the level when price pulls back to it after an upward move. That kind of confirmation – a retest of broken resistance that holds as new support – is the structure that technical traders point to as validation. Without it, any move through $2,500 risks becoming another false breakout, another data point for bears to cite as evidence that the level is holding.
The stakes are high enough that the outcome at $2,500 will likely define ETH’s Q4 narrative more than any single piece of macro news or network development. If buyers absorb the supply sitting at that level and the price closes multiple weekly candles above it, the technical picture shifts considerably. If bears reassert control there again, ETH enters Q4 with a ceiling it hasn’t been able to crack – even coming off its best Q3 in eight years. The tension between those two outcomes is, at this moment, unresolved.

Ethereum’s supply dynamics add another layer to watch. As ETH’s circulating supply continues to contract, the argument for a structural price floor grows – but contracting supply only becomes a price catalyst when demand shows up at the same time, and demand is exactly what the $2,500 zone is currently putting to the test.
Comments are closed, but trackbacks and pingbacks are open.