
Democratic Sweep Odds Push Bitcoin to 200-Day Line at $76,000
Bitcoin fell to $75,700 on November 3, 2026, as prediction markets shifted toward Democratic control of both chambers of Congress in the US midterm elections. The political repricing hit a coin already moving lower, and the collision of event risk with technical weakness has left traders in a narrow, uncomfortable position.
What the Midterm Odds Are Actually Pricing Into Bitcoin
The drop was not a reaction to any new law or formal policy announcement. It was a reaction to probability. As betting markets assigned higher odds to a Democratic sweep of Congress, Bitcoin sellers moved first. The concern driving that trade is straightforward: a Democratic-controlled Congress would likely stall or reverse the pro-crypto legislative agenda that has underpinned market sentiment for months.
That agenda includes pending market structure legislation and a regulatory posture from Washington that the industry has treated as a tailwind. Neither is finalized. Both depend heavily on which party controls committee chairs and floor scheduling after the vote. A sweep would almost certainly slow that process, and the market is discounting the possibility in advance rather than waiting for confirmation.
Bitcoin is down roughly 4% over the past week and about 10% over the past 30 days. The slide has not been a single violent break – it has been a steady grind with few meaningful countertrends. That pattern reflects sellers maintaining control rather than a single panic event, which makes it harder to call a bottom on sentiment alone.
Election headlines and shifting odds are now the dominant short-term driver. Crypto-specific developments – protocol updates, institutional flows, exchange data – are unlikely to move price as much as congressional vote tallies in the coming days. That is the nature of event risk: it temporarily overrides the fundamentals investors would normally watch.
Two Moving Averages Now Frame the Entire Trade
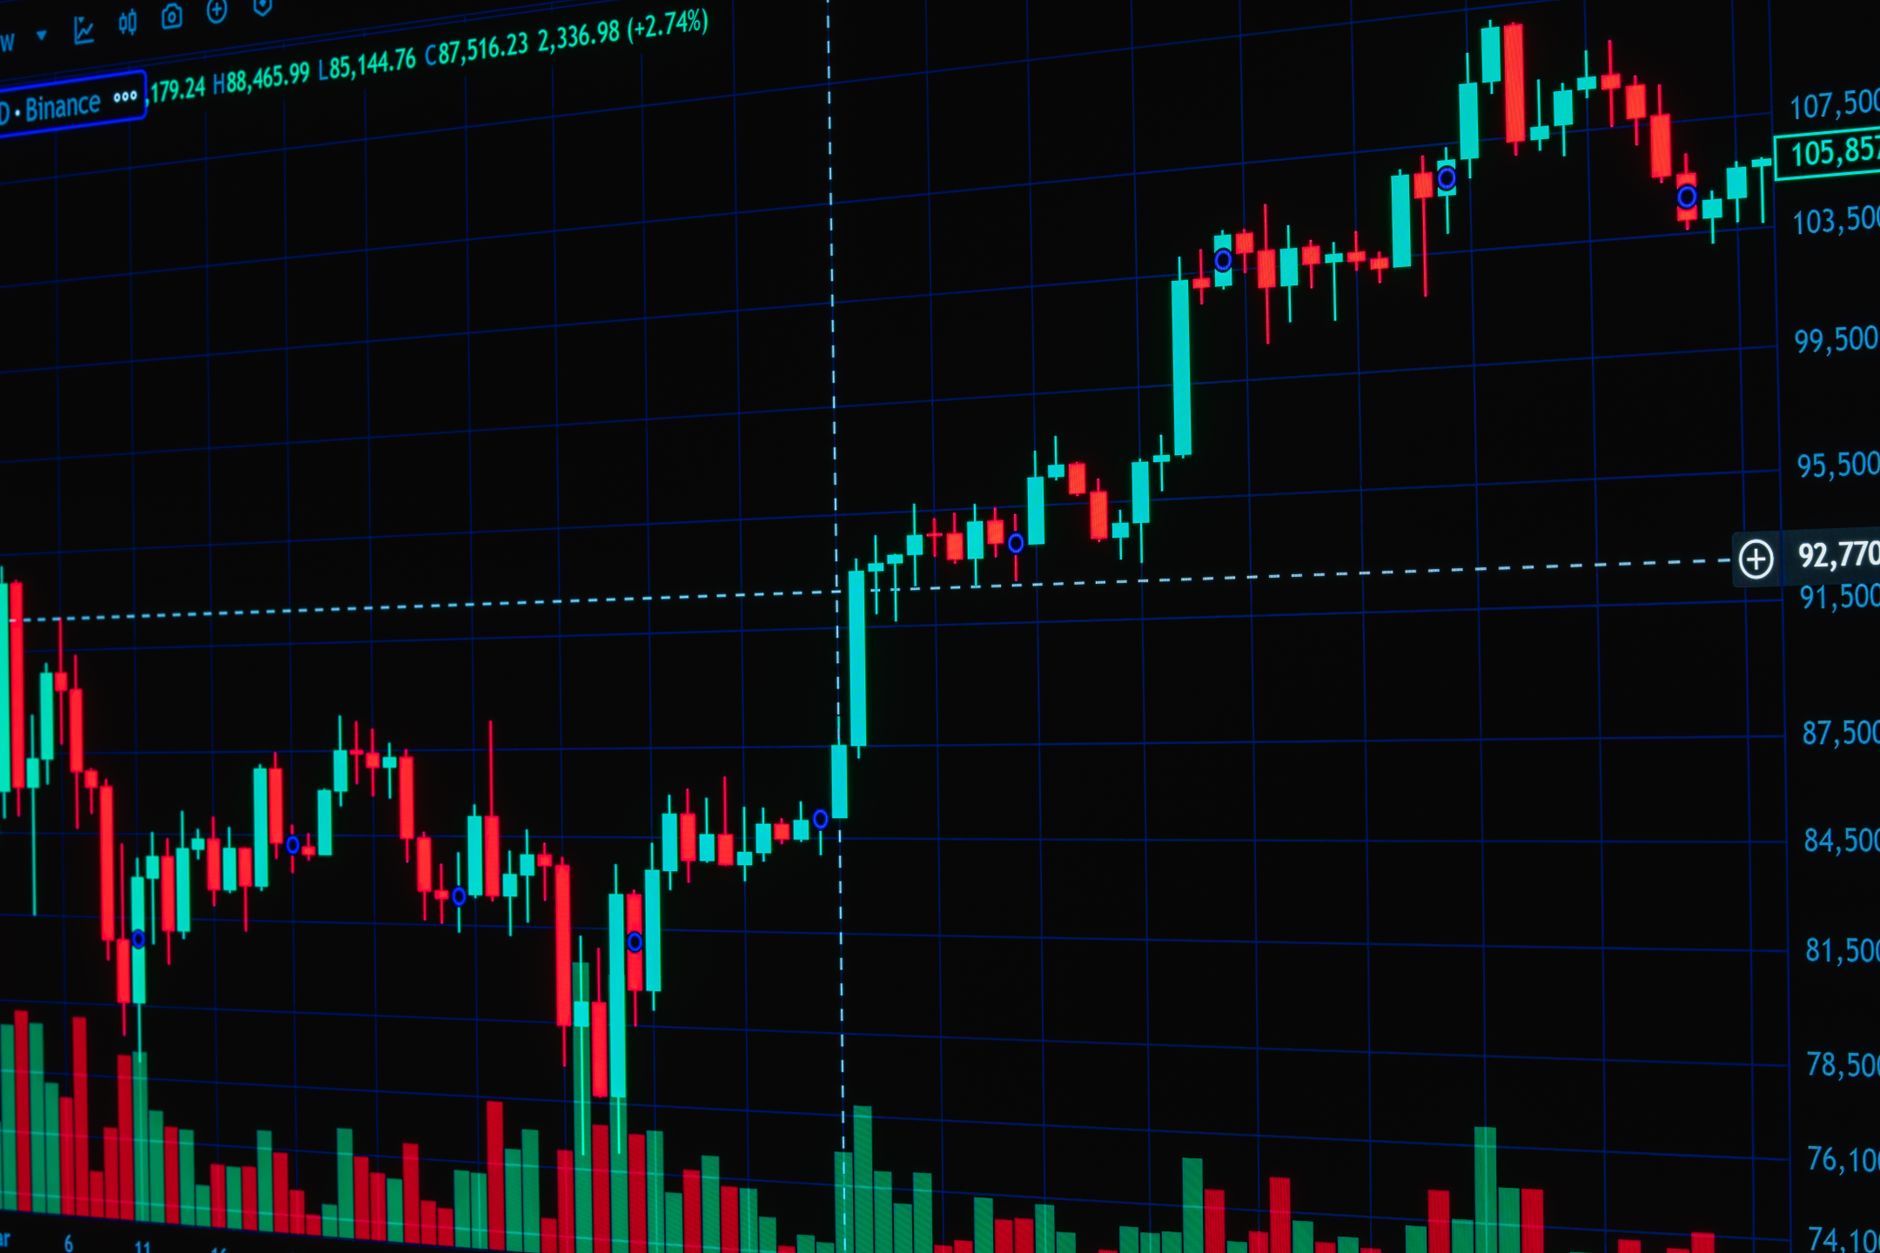
After the dip to $75,700, buyers pushed the price back up. Bitcoin was trading near $78,000 at the time of this writing, roughly flat over the prior 24 hours. That recovery is real, but it is shallow. It recovered ground without generating momentum, which matters for how the next move gets framed.
The 50-day moving average – a line that smooths price action over approximately the past two months – sits near $80,000. Bitcoin is trading below it. When price falls under a moving average that has previously acted as support, that average tends to flip into resistance. Traders who bought near $80,000 and are now underwater will often sell into bounces to limit losses, creating a ceiling effect. Every rally toward $80,000 is likely to find that overhead supply waiting.

Below the current price, the 200-day moving average rests near $76,000. This line smooths price over approximately the past year of trading and is widely used to distinguish short-term corrections from long-term trend breaks. Bitcoin is still above it – but barely. The election-driven dip to $75,700 touched that level and held. Whether that hold was genuine demand or simply a momentary pause is exactly what the next test will determine.
Between those two averages, Bitcoin occupies a band that is narrowing. A clean break above $80,000 would re-establish the 50-day as support and shift the technical posture back toward buyers. A close below $76,000 would breach the 200-day and open a gap in the chart with little visible support until around $65,000. That is a significant distance with no obvious floor in between, and it explains why traders on both sides are watching the current range so closely.
The legal and regulatory dimension makes the 200-day line more than a chart footnote. If Washington’s policy direction shifts after the midterms, the fundamental case that helped push Bitcoin through that level on the way up weakens. Technical support and regulatory sentiment are rarely discussed together, but right now they are pointing at exactly the same price zone. A Democratic sweep that stalls crypto legislation would hit the market precisely where the chart is most fragile.
Momentum Indicators Give Sellers the Edge
The Relative Strength Index on Bitcoin’s daily chart sits near 41. That figure sits in weak territory without yet reaching the oversold threshold below 30, which means sellers still have statistical room to push lower before the market becomes stretched enough to generate a forced bounce. An RSI near 41 is not a buy signal – it is a signal that selling pressure remains active and that the market has not yet exhausted the downside.
The MACD, which measures the relationship between shorter and longer-term price averages, remains below its signal line. That configuration indicates downward momentum has not reversed. The stabilization around $78,000 has not generated enough buying force to flip that reading. Additionally, trend-strength indicators are showing a new directional trend beginning to form – and it is forming in favor of sellers, not buyers. Trends that are early in development can still fade, but this one is gaining structure rather than losing it.
Swing traders looking for a reversal have little technical basis to act on yet. The RSI would need to approach oversold levels or show a clear divergence against price. The MACD would need to cross back above its signal line. Neither has happened. What exists instead is a stabilization that looks more like a pause ahead of the election result than a genuine shift in who controls the trade.

The $65,000 Gap and What It Means for Risk Management
If the 200-day average at $76,000 fails on a second test, the chart offers traders little comfort. Prior price structure between $76,000 and $65,000 is thin, meaning there are few historical consolidation zones where buyers previously absorbed selling in a way that would likely repeat. A break of the 200-day would not automatically send Bitcoin straight to $65,000, but the absence of intermediate support means any decline in that range could move faster than expected.
That gap is what makes the current regulatory backdrop so relevant to position sizing. The midterm election introduces a binary outcome: either the pro-crypto legislative agenda stays on track, or it faces a prolonged stall. Traders who understand that the fundamental narrative underpinning Bitcoin’s 2026 run is tied directly to Washington’s policy direction cannot treat the $76,000 level as a simple technical stop. If the policy wind reverses, $76,000 may not hold even if the chart alone would have supported it. The question for anyone holding a long position right now is whether the floor beneath them is made of technical support, or regulatory optimism that may not survive election night.
Comments are closed, but trackbacks and pingbacks are open.