
XRP Exodus From Binance Hits $540M While ETF Buyers Stay Dark
Record Withdrawals, No Demand Signal
On November 4, XRP holders pulled 418.5 million tokens off Binance in a single session – worth roughly $540 million at the time. CryptoQuant analyst Darkfost identified it as the largest single-day outflow in nine months, surpassing even the 315 million XRP that left the exchange on October 29, the day a security incident rattled Binance users. The speed and scale of the move pushed CryptoQuant’s Exchange Scarcity Index for XRP on Binance to 2.1, its highest reading since 2022, after spending all of September and October in negative territory.
What the withdrawal surge has not done is move the price. XRP traded near $1.16 early Sunday, essentially flat over the prior 24 hours but down roughly 7% on the week – positioning the token for its weakest weekly close since mid-August. Supply contracting on a major exchange while price continues falling creates a regulatory-relevant tension: when retail and institutional participation diverge this sharply, the question of who is driving behavior – and why – tends to attract scrutiny from market oversight bodies tracking manipulation signals and custodial transparency.
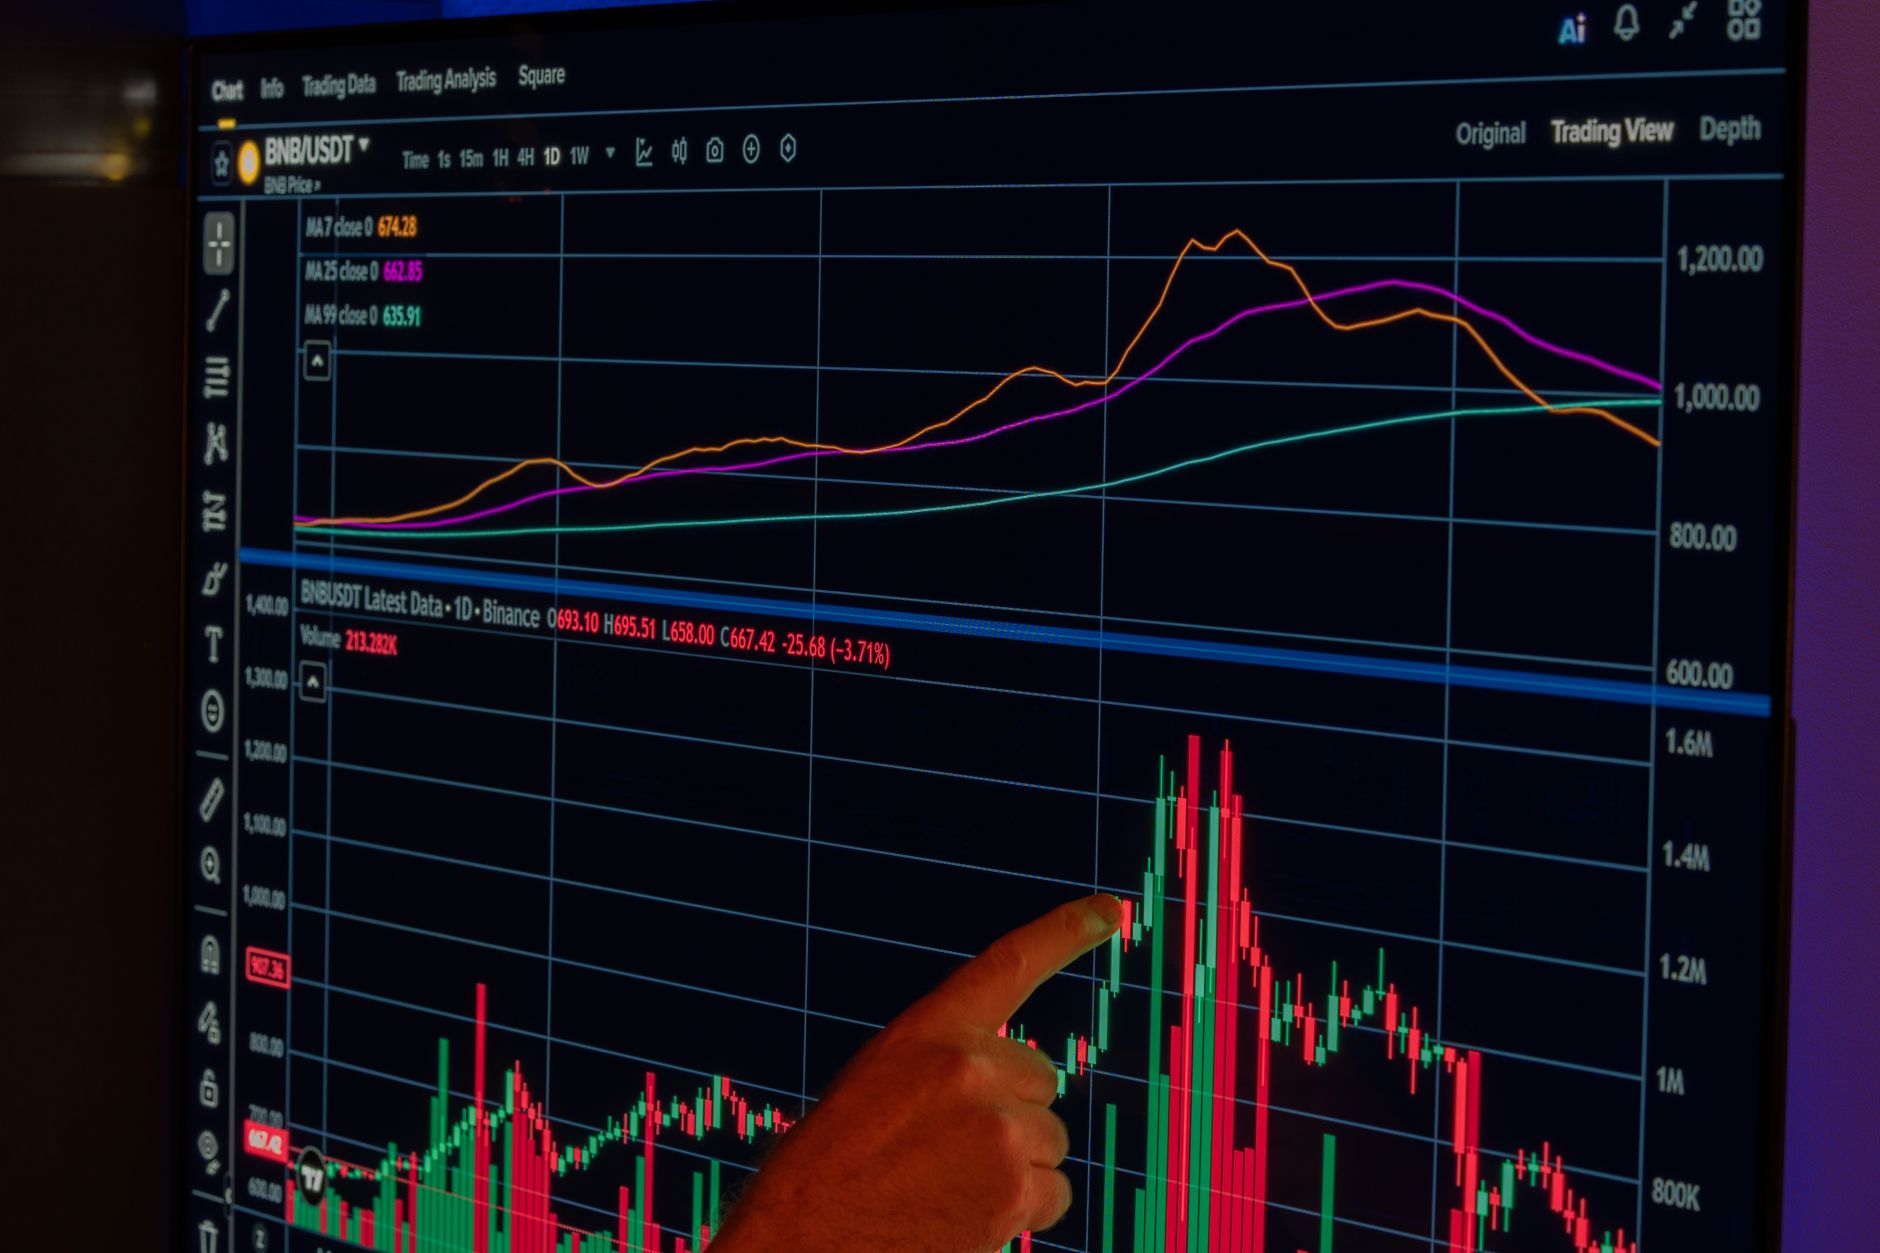
ETF Flows Went Silent as Scarcity Climbed
US spot XRP ETFs recorded zero days of net inflows across the entire week, according to SoSoValue data. The only logged movement on Monday was an outflow: a $529,500 exit from Canary Capital’s XRPC fund. Total assets under management across XRP spot products slipped from $1.425 billion to $1.34 billion, with most of the decline attributed to price depreciation rather than redemptions. Cumulative net inflows still stand at $1.81 billion since launch, but the weekly trend tracked sharply negative – October’s total inflow of $18.8 million was a fraction of September’s approximately $121 million. Bitcoin spot ETFs weren’t immune either, shedding about $1.3 billion over the same period.
The ETF silence matters for regulatory and market structure reasons. When institutional-grade products see consecutive days without a single dollar of net inflow while spot withdrawal activity spikes on the underlying exchange, regulators monitoring market integrity have cause to examine whether price discovery is functioning normally. Darkfost himself cautioned that some portion of the Binance withdrawals may represent internal wallet transfers rather than genuine accumulation by new buyers – a distinction that matters enormously for anyone assessing whether scarcity is organic or manufactured.

Price Structure and the $1.15 Floor Under Legal Watch
XRP’s weekly close history tells a deteriorating story. The token ended October 18 near $1.306, closed October 25 around $1.295, and landed at approximately $1.249 on November 1. A close at current levels would fall well below that November 1 mark – and XRP has not posted a weekly close below it since August 23. Breaking that floor would confirm sellers have successfully reset the price base for the first time in nearly three months, ending a run that had implied some demand resilience.
The technical gauge most watched by short-term traders sits at 32 on the daily Relative Strength Index – a 0-to-100 momentum scale where readings below 30 signal oversold conditions. Sellers retain room for at least one additional push before hitting that threshold. The MACD remains below its signal line, indicating downside pressure has not yet dissipated. Meanwhile, trend strength indicators show no directional conviction in either direction; XRP is declining on low volatility and thin volume, the kind of slow erosion that can persist because it doesn’t generate the sharp capitulation that typically resets buyer interest at a defined price.
The $1.15 zone has held since Saturday’s leverage flush, when overleveraged long positions were forcibly liquidated. A support level that survives a liquidation event tends to carry more weight than one that holds during low-volume drift, because it reflects genuine buyer participation at a specific price rather than passive price stickiness. Whether that support survives continued pressure is now the operative question – both for traders and for anyone watching how digital asset markets handle stress without regulatory circuit breakers or the kind of institutional backstops present in traditional markets.
What complicates the picture from a market oversight standpoint is the gap between on-chain behavior and price action. Large-volume exchange withdrawals, when genuine, typically signal that holders expect higher prices and are moving coins to cold storage. When those same withdrawals coincide with a 16% price decline over 30 days and total institutional silence via registered products, the signal becomes ambiguous. That ambiguity is exactly what market surveillance teams at exchanges and regulatory bodies are designed to investigate – especially as XRP ETFs operate under SEC-registered frameworks that require ongoing reporting of material fund changes.

What Accumulation Looks Like Versus Wallet Rotation
Distinguishing genuine accumulation from custodial housekeeping is harder than it sounds at scale. A holder moving 418 million XRP from a Binance hot wallet to a self-custody address could represent conviction buying, estate rebalancing, a corporate treasury move, or simple exchange-risk management after October’s security incident. None of those motivations are equivalent in market impact, and only one – fresh buying from outside the existing holder base – creates upward price pressure.
The absence of ETF inflows suggests the institutional layer isn’t adding exposure. The absence of price recovery despite a historic withdrawal day suggests spot demand isn’t absorbing sell-side pressure either. Bitwise’s decision to close its DOGE ETF while Dogecoin traded below $0.09 showed what happens when fund products lose commercial viability during price declines – a scenario XRP spot products are not yet near, with $1.34 billion in AUM still on the books, but one that becomes relevant if October’s $18.8 million inflow pace continues into November.
The 50-day moving average sits near $1.31 and the 200-day near $1.36 – both above current prices and both now acting as resistance ceilings buyers must clear for any recovery to hold. That is a 13% to 17% gap between current price and the averages that would need to close before momentum traders return and trend-following funds re-engage. With ETF inflows at zero and exchange withdrawals not yet translating to buying pressure, the distance between $1.16 and $1.36 is not just a chart gap – it is the width of the question the market has yet to answer.
Comments are closed, but trackbacks and pingbacks are open.