
CASHCAT Bears Eye $0.08 as Technical Signals Stack Against Bulls
A Token Under Pressure
CASHCAT is sending distress signals across its technical chart, with multiple indicators aligning against the bulls and a key support level at $0.08 now firmly in traders’ crosshairs.
What the Chart Is Actually Saying
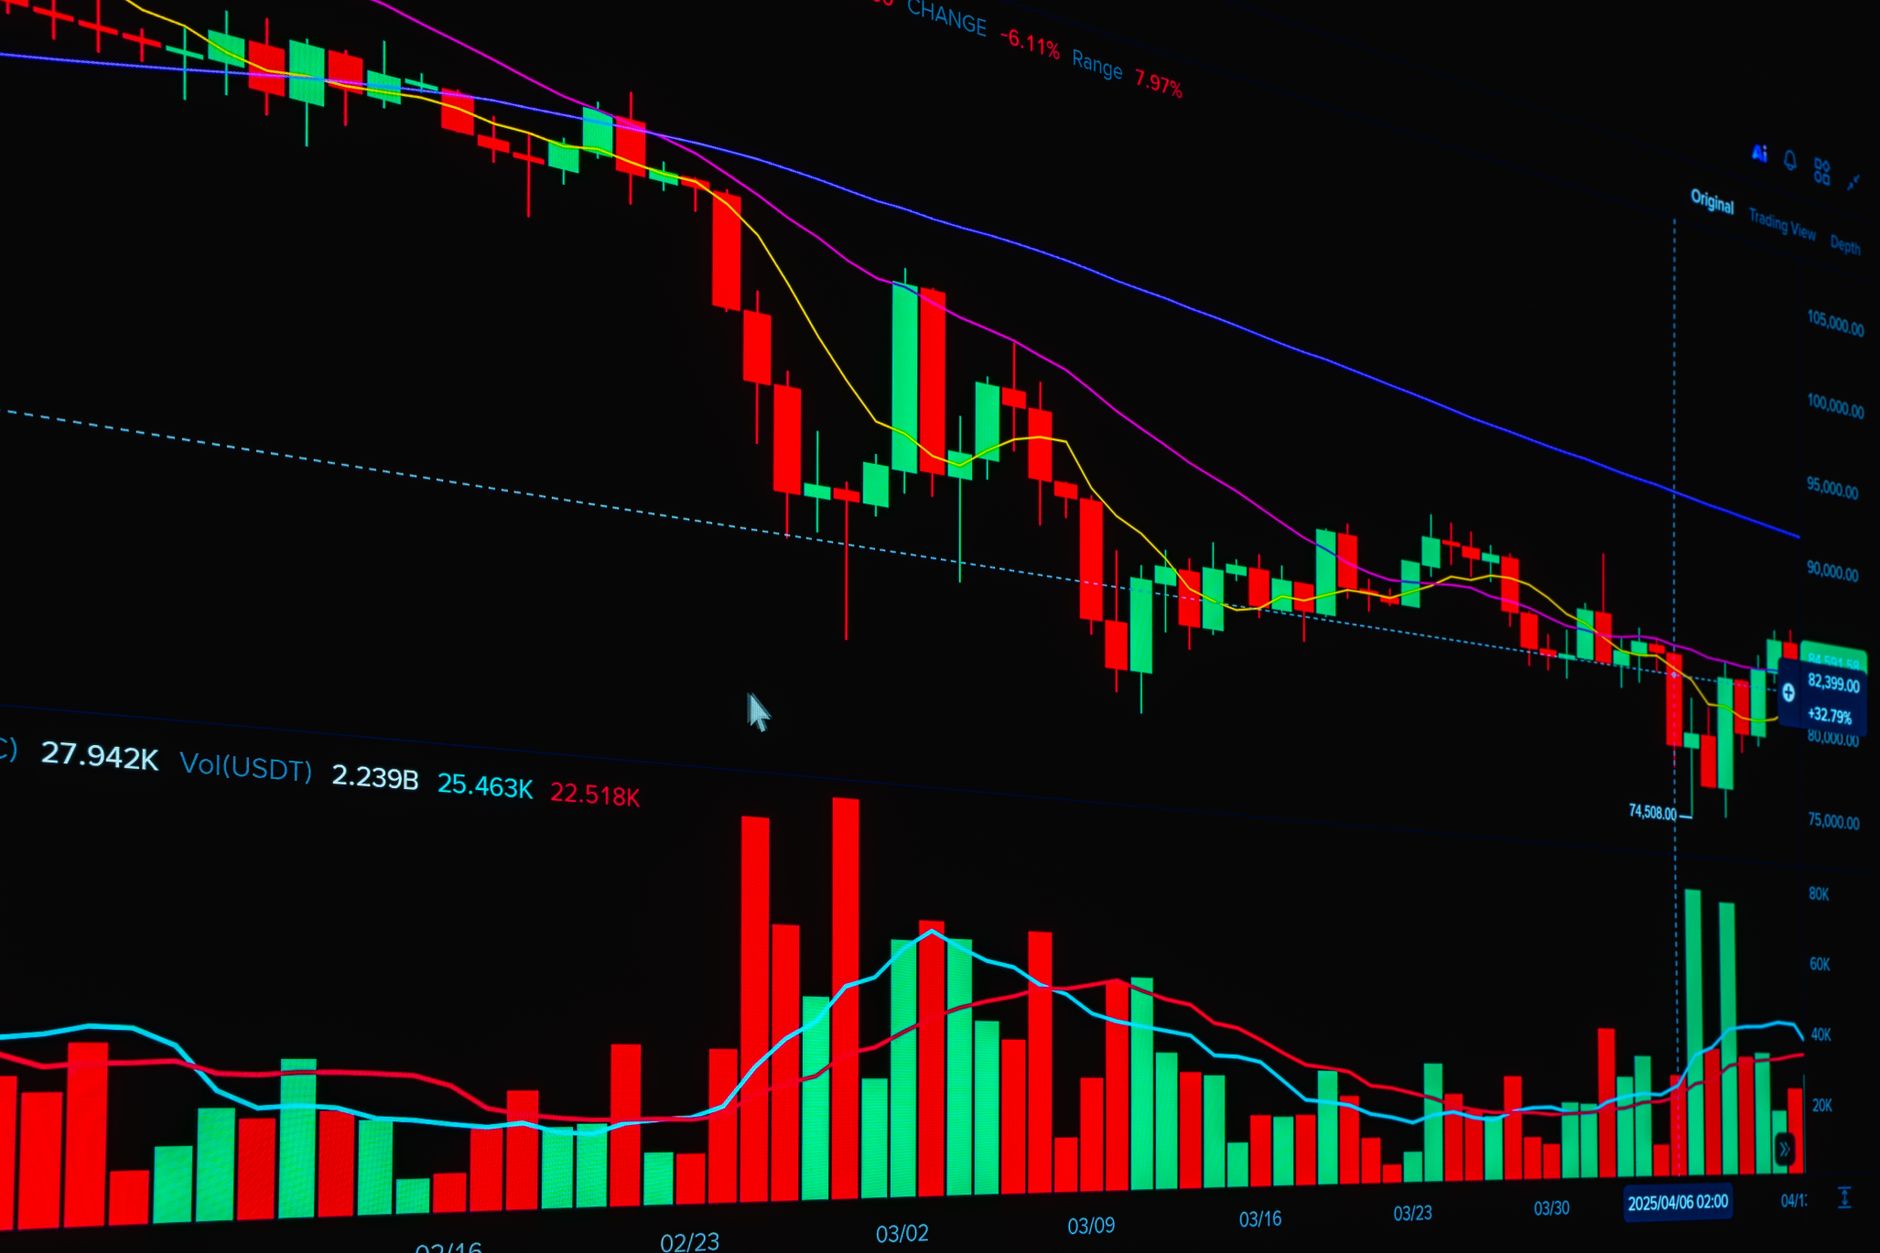
Bearish technical indicators are currently dominating CASHCAT’s price structure. This isn’t a single divergence or a lone moving average crossing the wrong way – the signals are stacking, and that accumulation of negative pressure is what has analysts and short-term traders watching the $0.08 level as a realistic downside target rather than a worst-case scenario.
When multiple technical indicators converge in the same direction, the probability of a follow-through move increases meaningfully. In CASHCAT’s case, that direction is downward. Whether it’s momentum oscillators running cold, price action failing to hold above key levels, or volume failing to confirm any recovery attempts, the chart is not offering bulls many places to stand.
The $0.08 level carries weight precisely because it represents a clean technical reference point. In lower-cap tokens like CASHCAT, round numbers and prior consolidation zones tend to act as magnets during selloffs – price doesn’t just drift past them, it gets pulled toward them as stop orders cluster and traders reassess positioning. If the current bearish structure holds, that zone becomes less of a floor and more of a destination.
Short-term traders watching CASHCAT right now are essentially dealing with a tension between what the spot market is showing and what the futures market is implying. The spot side looks weak. The chart structure is not giving bulls a clean catalyst to point to, and without one, any bounce attempt risks being absorbed by sellers who have been waiting for relief to exit.

Funding Rates Are Telling a Different Story
Here is where CASHCAT’s setup gets genuinely complicated: funding rates for CASHCAT futures are sitting in positive territory. That means futures traders – the crowd using leverage and paying to hold positions – are still net long. They are still, collectively, betting on a rebound.
Positive funding rates in a declining market create a specific kind of pressure. Longs are paying shorts to maintain their positions. If the price doesn’t recover quickly enough, those funding costs erode the trade. Eventually, some long holders capitulate, close positions, and that selling pressure feeds into the spot market. It’s a mechanical process that can accelerate a downside move even when sentiment hasn’t fully turned bearish at the retail level.
The divergence between bearish spot technicals and positive futures funding is the core tension in CASHCAT right now. Neither signal cancels the other out – they coexist as competing forces. Futures traders expecting a rebound could be right. The technical indicators pointing south could be wrong, or early, or both. Markets regularly produce conditions where one group of participants is badly offside, and the resolution tends to be sharp in whichever direction forces the capitulation.
What the positive funding rate does confirm is that there is still a meaningful population of traders who see current prices as an opportunity rather than a warning. That matters because it means CASHCAT has not yet reached the stage of total sentiment collapse where everyone has given up. The bulls are still in the game, still paying to stay long, still waiting for the price action to vindicate them. Whether that confidence survives a sustained move toward $0.08 is a different question entirely.
For short sellers, positive funding in a downtrend is actually a favorable environment – they collect the funding payments while the technical picture works in their direction. That dynamic can sustain bearish trades longer than the chart alone might suggest, and it adds a financial incentive structure that reinforces the downside case on top of the technical one. Traders on both sides of CASHCAT are effectively paying attention to the same data and drawing opposite conclusions from it.
The $0.08 Level and What Happens There
If CASHCAT does reach $0.08, the behavior at that level will be more informative than the journey down to it. A sharp rejection with volume would suggest the level is functioning as genuine support – buyers stepping in with conviction, not just a temporary stall. A slow grind through it with low volume would indicate exhaustion rather than accumulation, and in that scenario, the next meaningful support would need to be identified further down the chart.

The futures market’s continued optimism means that a snap recovery is not off the table – positive funding rates have historically preceded short-covering rallies in smaller tokens when even modest buying pressure catches overleveraged shorts off guard. But with bearish technical indicators holding firm and no obvious catalyst on the horizon, CASHCAT traders are essentially asking which breaks first: the chart structure, or the conviction of the futures longs still paying to stay in the trade.
Comments are closed, but trackbacks and pingbacks are open.