
XLM Bounces Near October Lows as Recovery Attempt Stalls
A Bounce That Hasn’t Gone Anywhere
Stellar’s XLM has nudged higher in recent sessions, but the move has done little to change the broader picture. The token remains pinned near the same depressed levels that defined much of October, and a recovery attempt earlier in the week collapsed before it could establish any meaningful ground.
That failed push carries more information than the current slight uptick. When a recovery attempt breaks down close to where it started, it signals that buyers aren’t yet strong enough to absorb the selling pressure sitting above current prices – and XLM’s chart is saying exactly that right now.
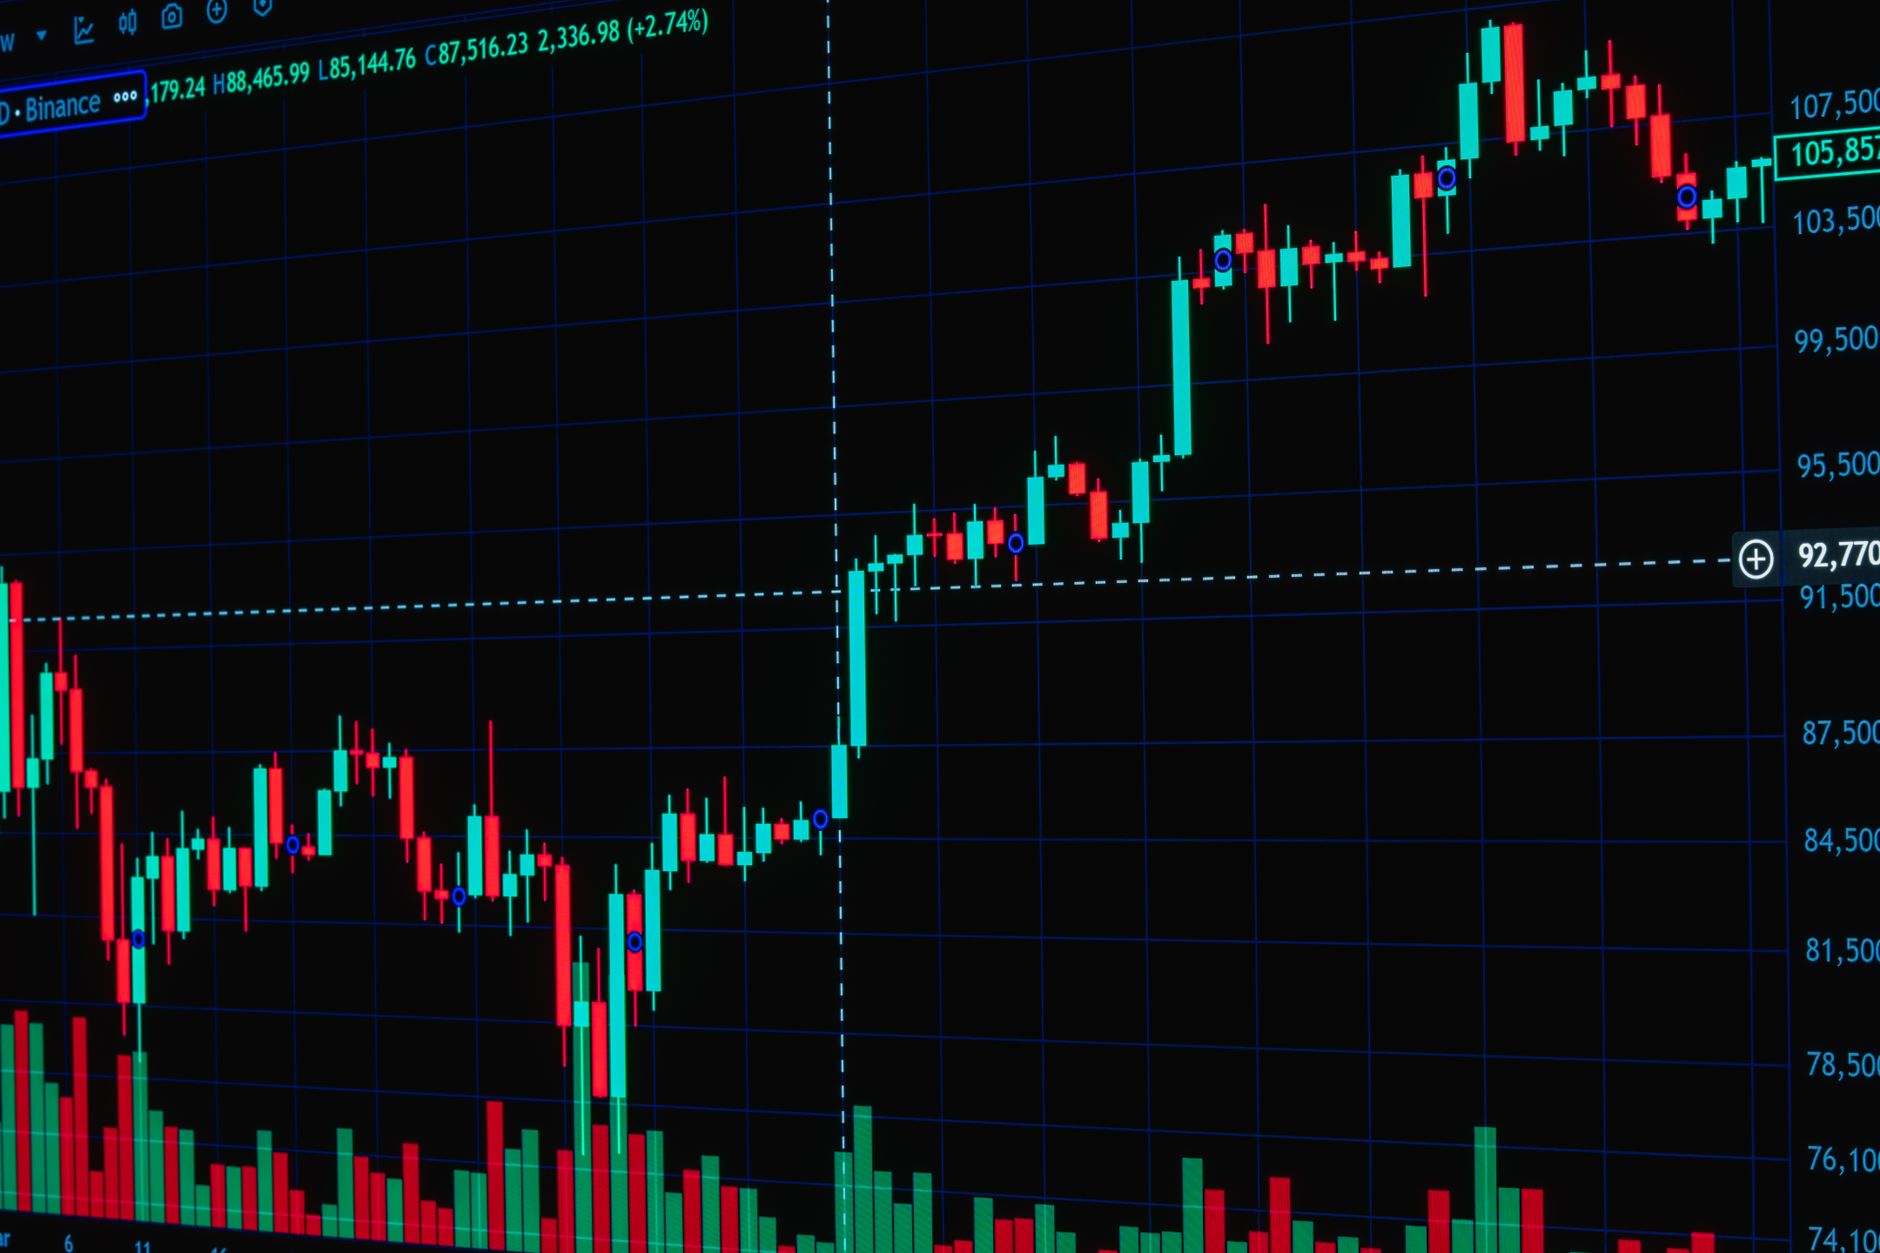
October’s Damage Is Still Running the Trade
The October slide left a visible mark on XLM’s structure. Prices fell to familiar lows – levels the asset has tested before – and the lack of a strong bounce from those levels is itself a data point. Markets that have real buyer interest at a support zone tend to reject it quickly and sharply. A slow, grinding edge higher without momentum behind it often precedes another test of the low, or a break below it.
What made this week’s recovery attempt worth watching was its timing. It came after a period of compression, which sometimes produces a directional move as pressure builds and releases. Instead, the attempt faded. XLM drifted back toward the lower end of its range without triggering the kind of volume or follow-through that would suggest accumulation rather than indecision.
That distinction matters for traders trying to read where XLM is headed next. Accumulation leaves a footprint – sustained buying at a price floor, repeated tests that each hold more firmly, volume picking up on up-days and thinning on down-days. None of those signatures are visible in Stellar’s current price behavior. The bounce looks more like a relief move than the start of a structural recovery.

What the Failed Recovery Reveals
A failed recovery is one of the more reliable signals in technical trading – not because it always leads to a breakdown, but because it clarifies where the real resistance sits. XLM’s inability to push through earlier this week now marks a specific price zone as overhead supply. Sellers who were waiting for a bounce to exit their positions got that opportunity and took it.
That dynamic compresses the trading range from above. Buyers are tentative near current lows, sellers are active at the recent recovery high, and the space between them is shrinking. A market that tightens this way eventually resolves – either with a decisive break lower as buyers give up, or a sharp move higher if something fundamental shifts the supply-demand balance in XLM’s favor.
Reading the Setup From Here
For traders positioned in XLM or watching it from the sidelines, the current setup offers a relatively clean read. The failed recovery earlier this week functions as a reference point. If XLM cannot close above that level on a subsequent attempt, the probability that October’s lows get retested – and potentially broken – rises considerably. If it does reclaim that zone with volume, the picture changes.
Short-term, the slight upward edge in price is less meaningful than how the asset behaves at the boundaries of its current range. A token that drifts higher without commitment is still in a downtrend – it’s just in a quieter part of it. Stellar spent most of October establishing that sellers are in control at higher prices, and nothing in the latest price action has challenged that conclusion.
The broader context for XLM adds another layer of pressure. Altcoins that underperform during market-wide recoveries tend to lag further when sentiment shifts again. Stellar hasn’t shown the relative strength that would separate it from that pattern. While other assets have shown sharper bounces off their own October lows, XLM has moved tentatively – a disparity that traders focused on momentum will notice.
The most informative moment in Stellar’s recent price history isn’t the current slight uptick. It’s the earlier bounce that didn’t hold. That sequence – attempt, failure, drift – is the dominant pattern right now, and it’s one that places the burden of proof squarely on buyers. Until XLM produces a recovery that doesn’t reverse at the first sign of resistance, the October slide remains the controlling trend.

Watch the recovery high from earlier this week. That level is now the line that separates a continuation of October’s damage from any legitimate case for a change in direction.
Comments are closed, but trackbacks and pingbacks are open.