
Avalanche Faces $7 Test Before Any 1,100% Rally Marks Predicts
Analyst Javon Marks says Avalanche could climb more than 1,100% from current levels. With AVAX trading near $8.28, that math lands at roughly $99, a price the token has not seen in years. The call arrives at an awkward moment. AVAX lost about 19% over the past month and still sits under both of its major moving averages.
The live chart is far less ambitious.
Marks offered no time frame and no conditions. He described a “potential” run higher and rested the case on the token’s long-term chart structure alone, with no network data and no new catalysts attached. Traders watching the daily chart are asking a narrower question: can AVAX hold its nearest floor at $7.77, or does a slip toward $7 come first? A daily close below that floor would open the way to the next support near $7.05, and it would weaken the bullish structure Marks is leaning on.

A Target With No Deadline and No Exit
The shape of the call matters as much as the number. A forecast with no date cannot be checked against anything. It can sit unfulfilled for months or years and still be described as “potential.” It also names no point of failure, no price at which the analyst would say the idea was wrong. The levels on the daily chart are the opposite: specific, close to the current price, and testable within days.
The arithmetic is simple enough. A 1,100% gain from $8.28 puts AVAX near $99. If the token first dropped to the $7.05 support, it would need to multiply about 14 times to reach the same mark. That is a long way to travel from a chart that currently shows no strong trend in either direction. Marks relies on price history only, and price history records what buyers and sellers have done, not why they would return in force. Nothing in the call explains who steps in at $9 or $20 or $50.
Readers should treat it as one analyst’s view, not guidance. The original analysis carries the standard disclaimer that it is not legal, tax, investment or financial advice.
Twin Averages Cap the Price, Momentum Edges Up
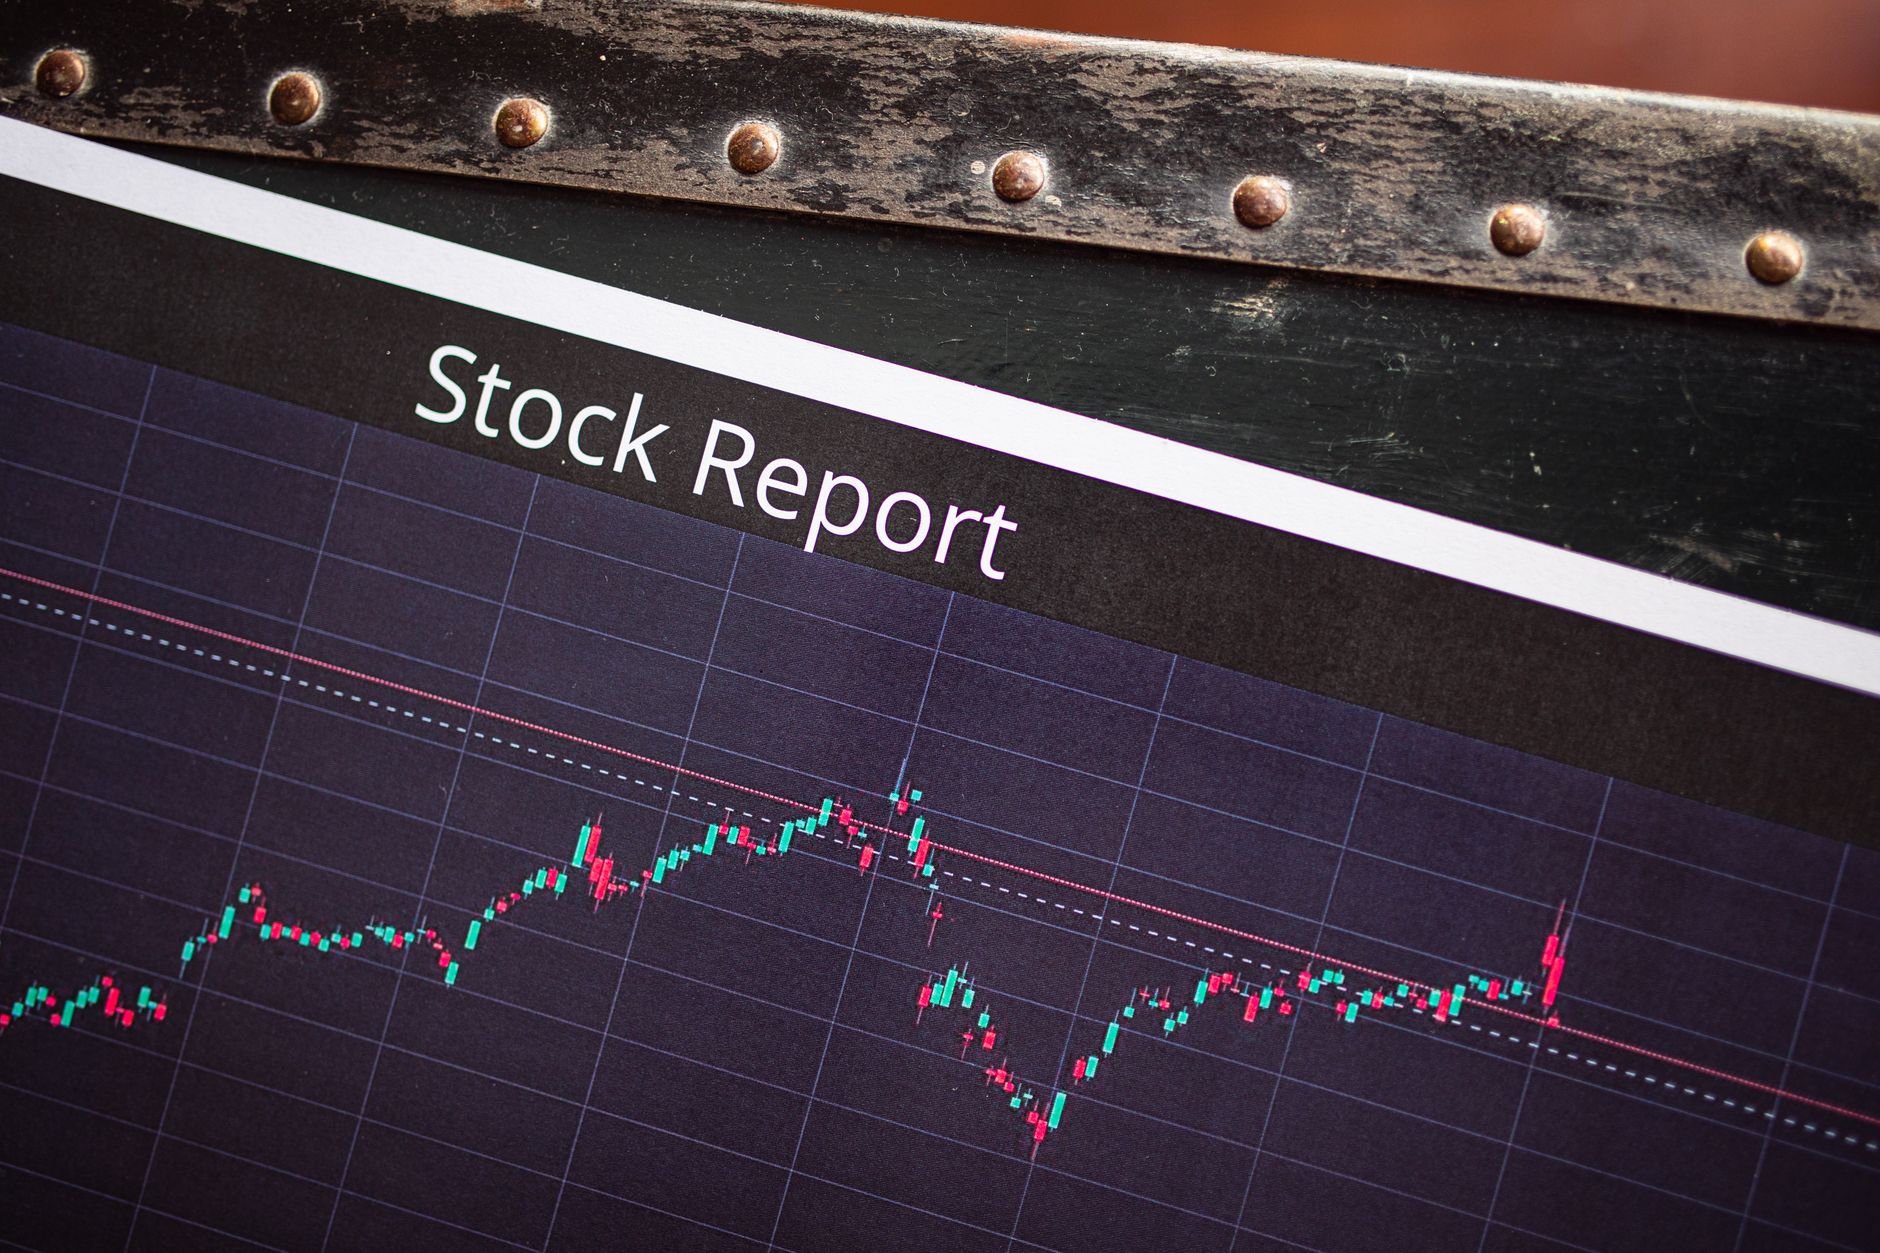
AVAX remains under both key moving averages. The 50-day average, which tracks roughly the past ten weeks of prices, sits near $8.94. The 200-day average, a gauge of the longer trend, is close by at about $9.01. Both lines are 8% to 9% above the current price, and with the two so tightly bunched they act as a single ceiling. Sellers have stepped in each time the token approached that band in recent weeks. Until buyers push the price back above both lines, the broader trend still points lower. The monthly loss of about 19% is what pulled the token so far beneath them. Over the past week AVAX gained about 1%, and it has been flat over the last day, so the selling has eased without buyers taking over.
Momentum readings split into two stories. The daily RSI, a 0 to 100 gauge of momentum, reads about 42, which is weak territory. Sellers hold a slight edge, though the reading leaves room for a move in either direction. The MACD, which compares short and longer price averages, has crossed above its signal line. That shift suggests the selling pressure of the past month is fading. Trend strength, however, tells a quieter tale. The data shows no strong trend in place, up or down, so AVAX looks more likely to drift sideways inside a range than to break out sharply.
The levels frame the range. Support sits near $7.77, about 6% under the current price, and buyers have held that zone through the recent pause. Below it, the next floor is around $7.05, roughly 15% lower. Overhead, the nearest resistance stands near $9.15, just above the twin averages and about 10% higher. A close above it would flip the short-term picture in favor of buyers, with the next hurdle around $9.76. Clearing that would mark a broader recovery from the monthly slide.
The chart offers two paths over the next three days:
- Bullish: A daily close above the nearest resistance would put AVAX back over its twin averages and aim it at the next hurdle. Improving momentum would support that push. The setup fails if the token slips back under its first support.
- Bearish: A break of the first support would point to the lower floor and test Marks’ call early. The bearish case fails if buyers reclaim the 200-day average.

The distance between AVAX and Marks’ $99 is about $90, and the first $0.51 of it runs the wrong way, down to $7.77.
Comments are closed, but trackbacks and pingbacks are open.