
Bitcoin Stalls at $87K as Bulls and Bears Fight for Next Move
Resistance Holds, But Pressure Is Building
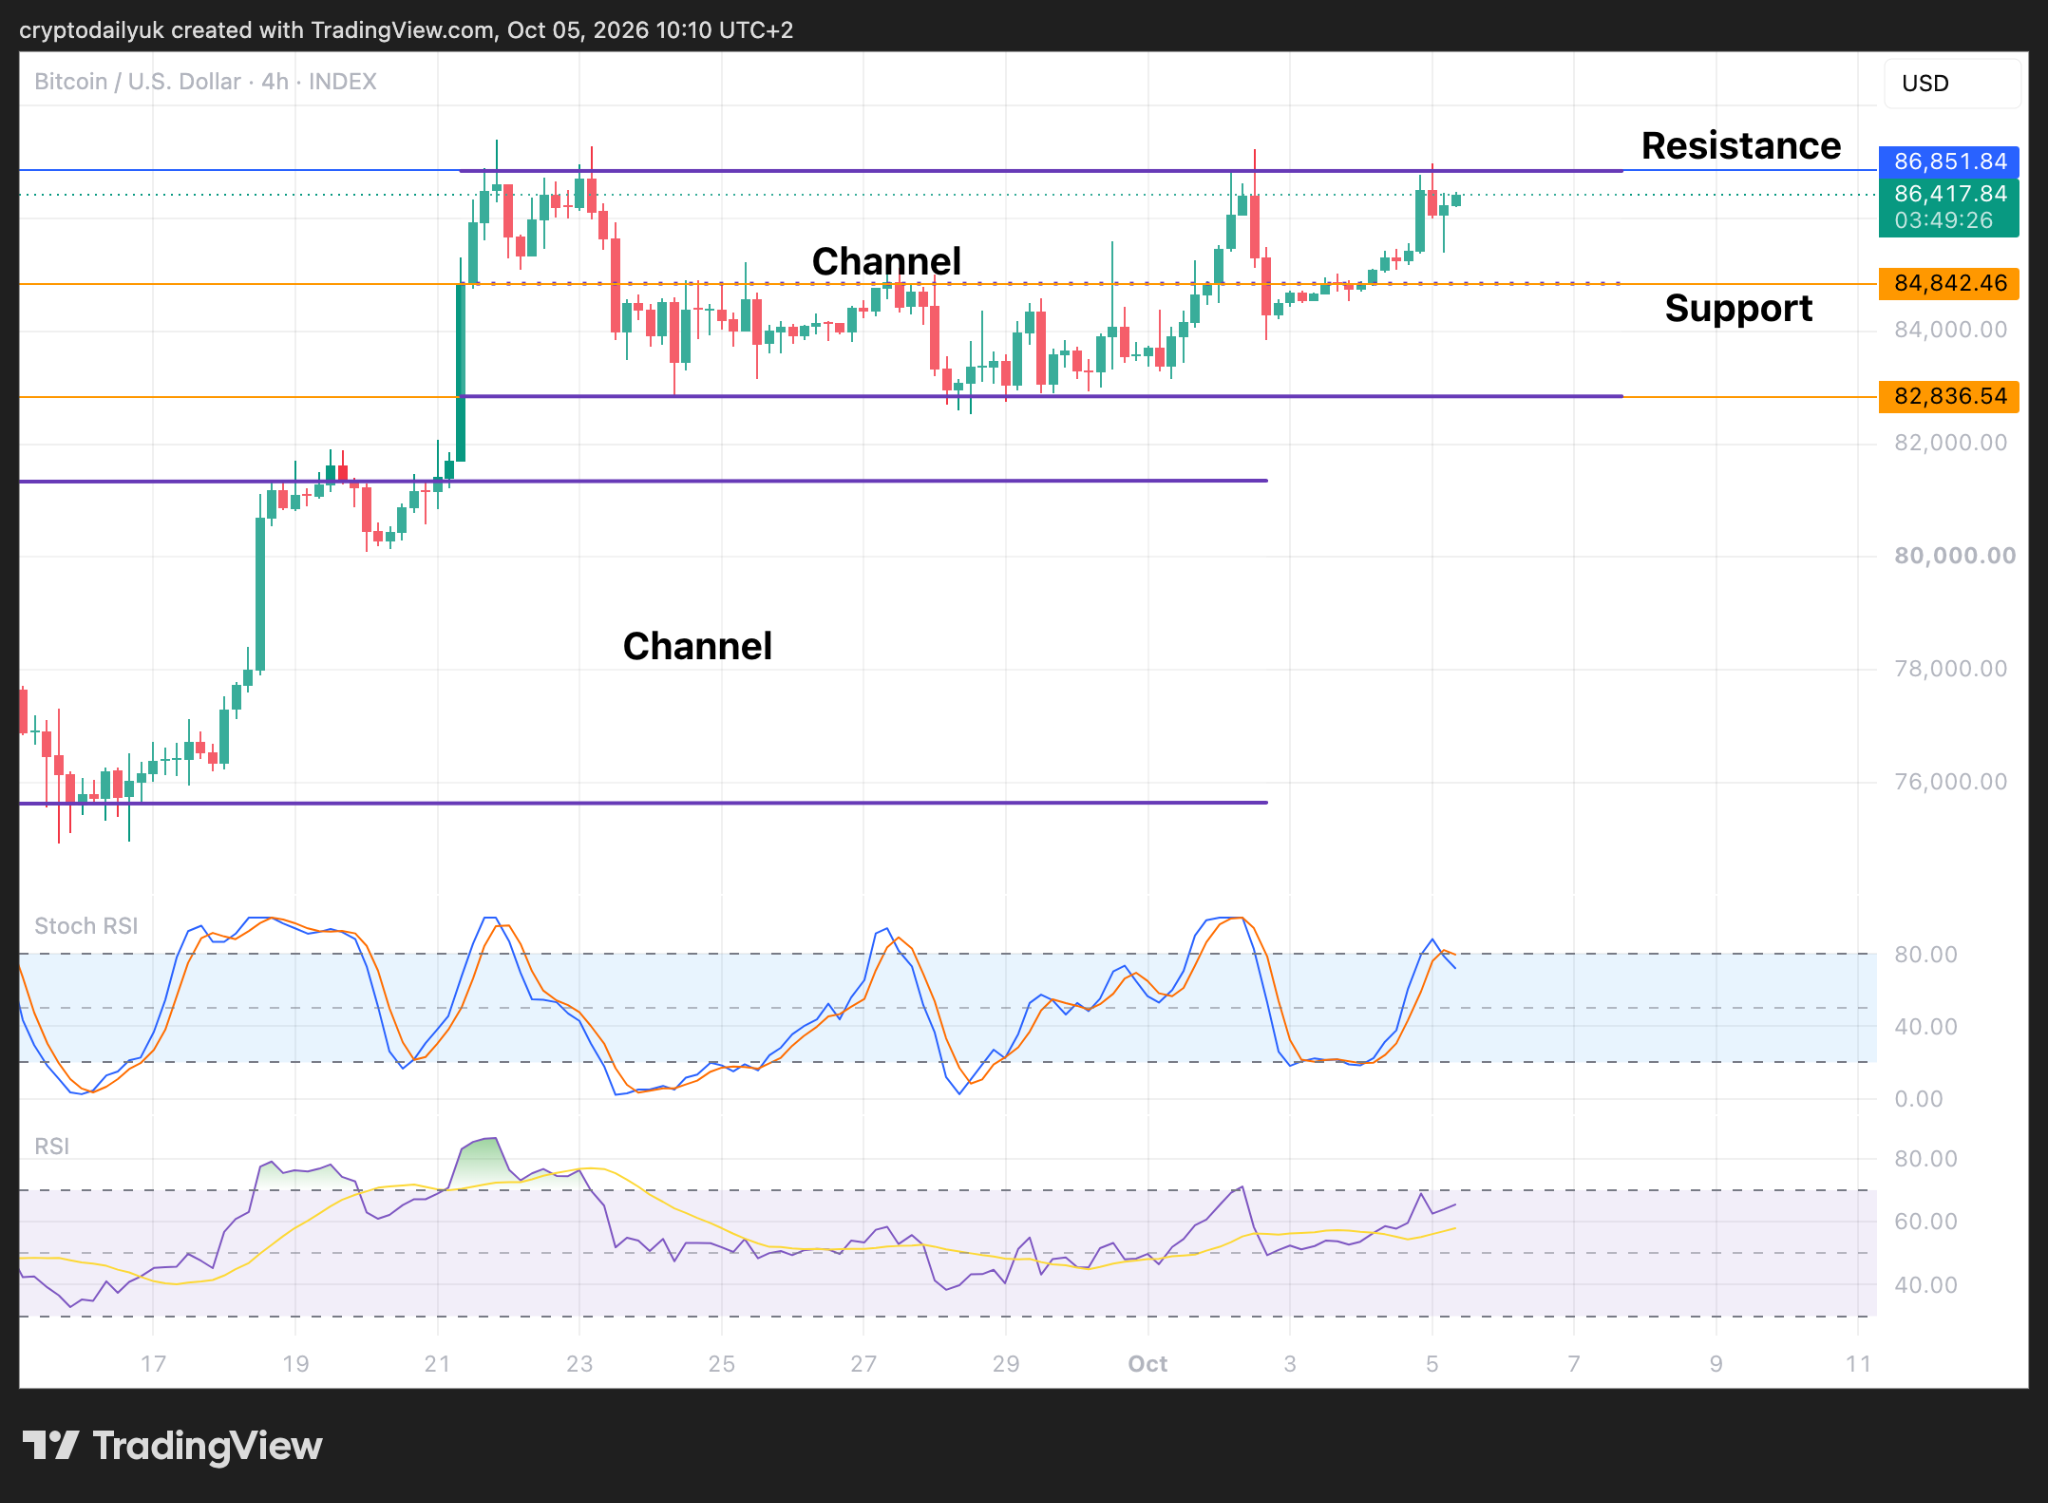
Bitcoin has returned to the $87,000 horizontal resistance level for another test – and still no breakout. The longer this standoff continues, the sharper the eventual resolution is likely to be.

Two Channels, Two Readings
On the short-term chart, Bitcoin’s price action has formed two bull flags – nested channels – with the price currently sitting in the upper channel and pushing against its ceiling. From a bullish read, repeated contact with the upper trendline increases the probability of a clean break to the upside. Each test adds pressure; at some point, resistance gives way.
The bearish interpretation of the same chart is harder to dismiss. Lower highs have been printing consistently since the very first candle wick that pierced above the channel boundary when the pattern began forming. That’s a classic sign of weakening momentum dressed up in a continuation pattern.
Momentum indicators are giving a mixed signal. The Stochastic RSI has turned down – a near-term caution flag – but the standard RSI at the bottom of the chart still has room left to run. Overbought territory has not been entered, which means the bulls haven’t exhausted their fuel. That distinction matters. A rejection from a non-overbought RSI carries different weight than one that comes after the indicator has pinned itself against the ceiling.
What’s notably absent from these bull flags is the classic downward tilt that typically precedes a deeper consolidation. That angle usually acts as a pressure-release valve, letting sellers exhaust themselves before buyers regain control. Without it, the pattern is less textbook – though the continuation scenario still carries better-than-even odds given that the broader trend remains pointed upward.
Where the Daily Chart Puts Things in Perspective
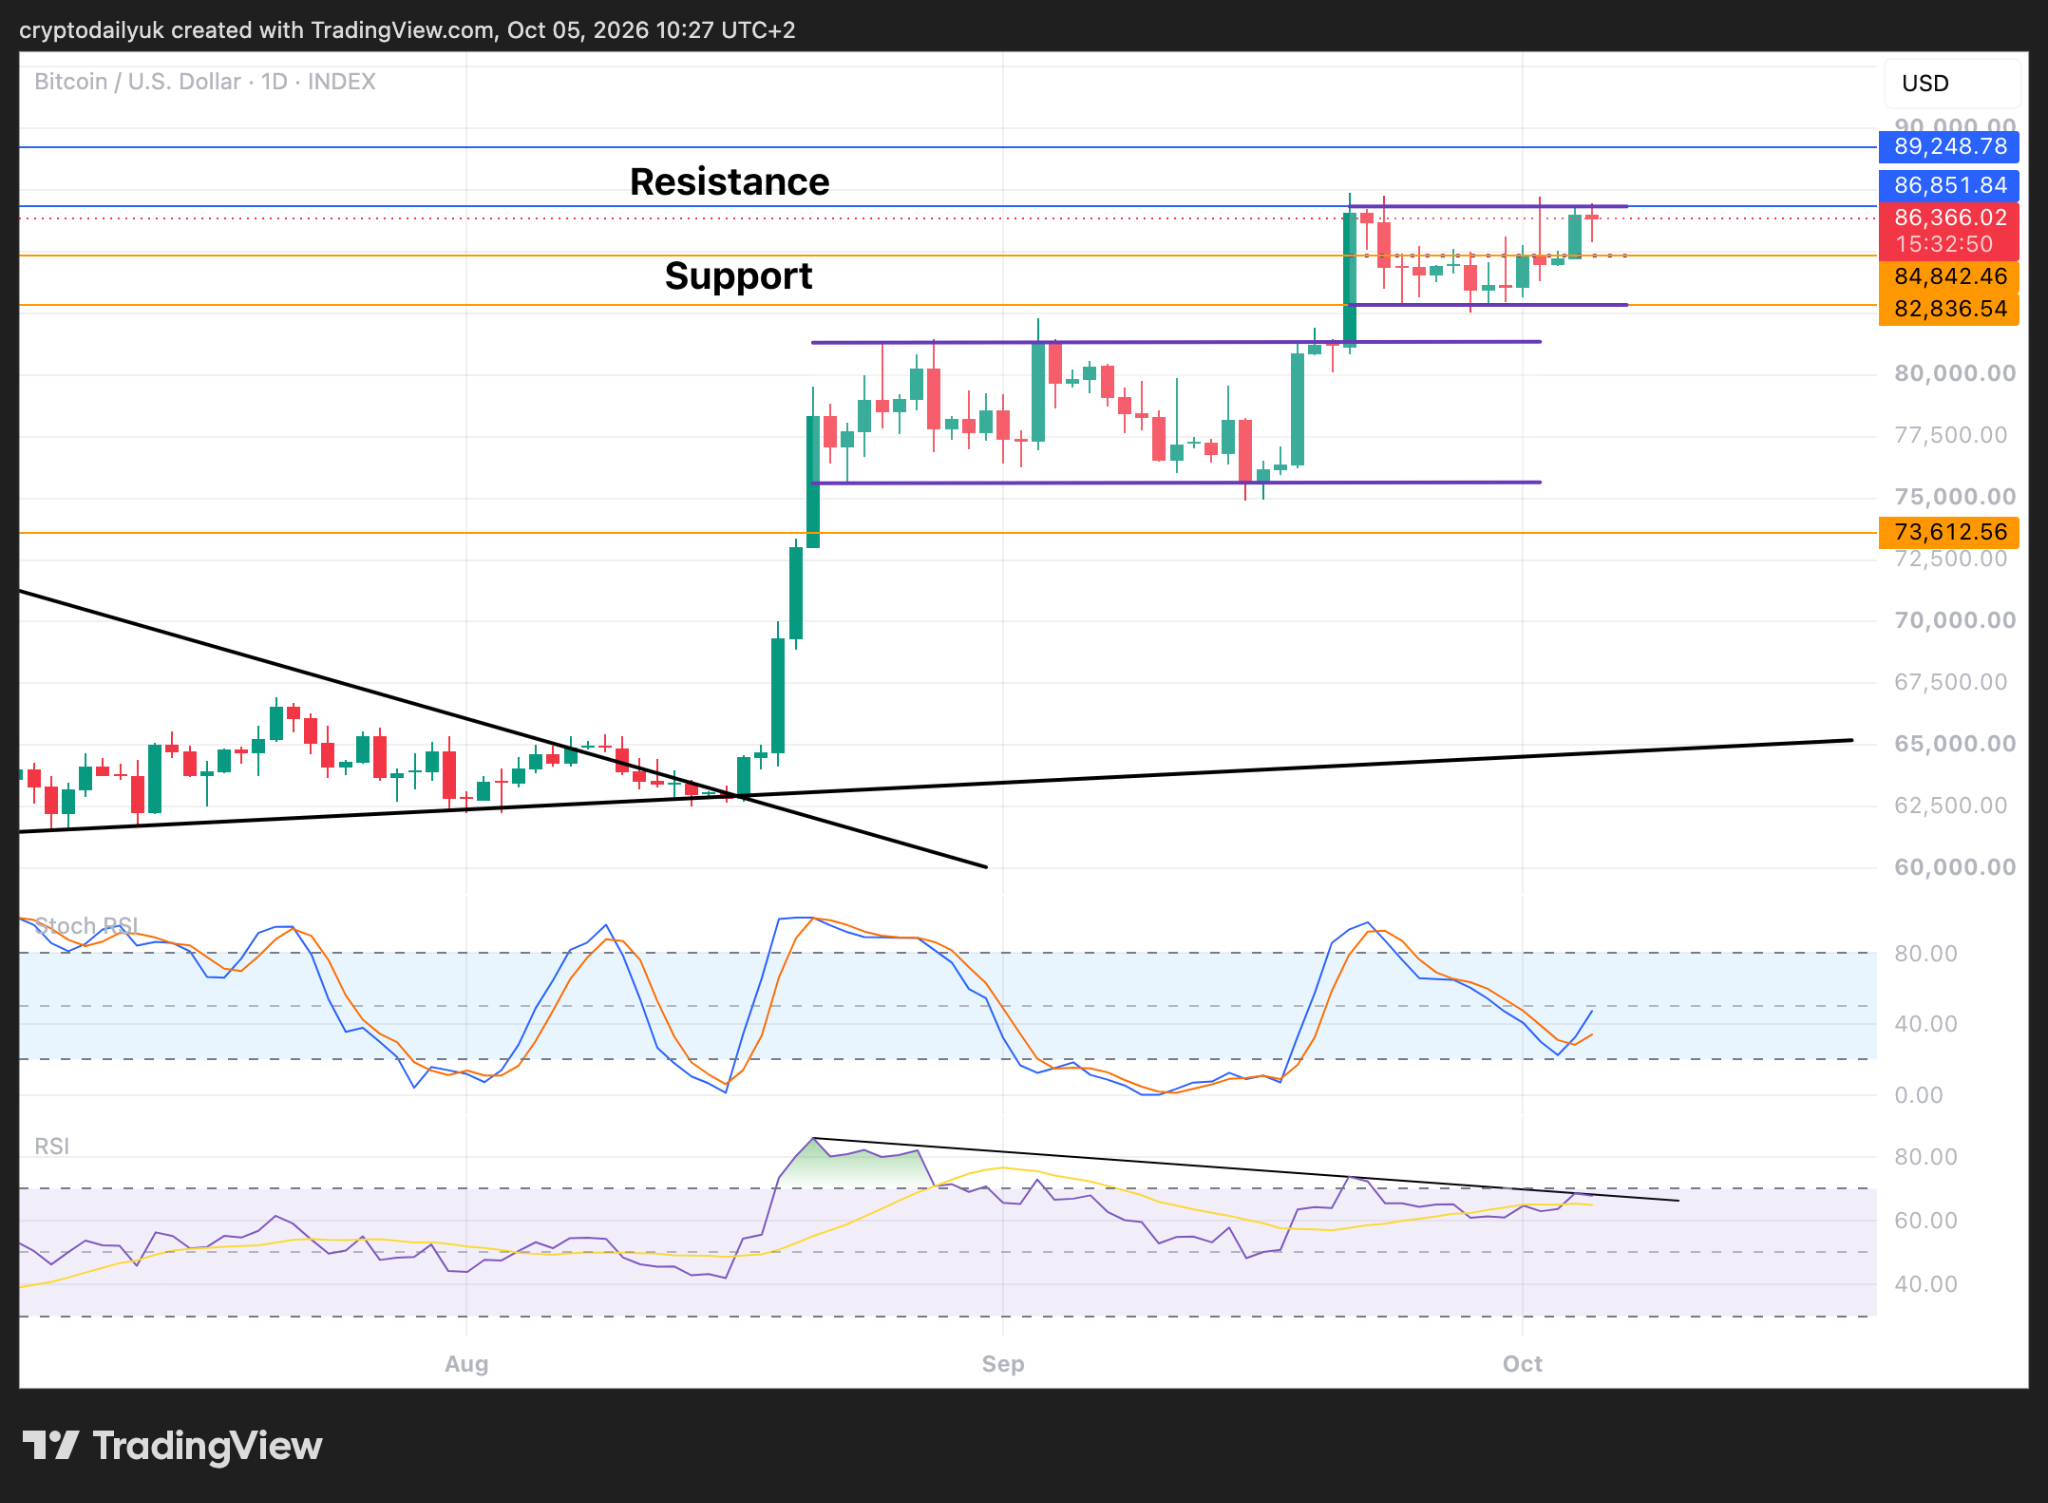
Step back to the daily timeframe and the picture changes meaningfully. The main upside rally that began after the bear market trendline was broken remains fully intact. No structural damage has been done. The question isn’t whether the trend is up – it clearly is – but whether Bitcoin can clear the next stair step and enter a new consolidation range above current levels, or whether this is the rejection that finally delivers the first meaningful correction.
That correction, when it comes, is expected to be deep. The working scenario among those tracking this rally is that it could take the shape of a much larger bull flag or a falling wedge – structures that would mirror the pattern seen in the lead-up to the peak of the last bull market. Before that happens, though, there may be one more leg higher.
The bear market is not technically over. That threshold sits at $97,880
A target of $94,000 is on the table for the next bullish leg. Getting there won’t happen in isolation. Two conditions are being watched alongside Bitcoin’s chart: U.S. bond yields need to reverse, and the U.S. stock market would need to push toward 8,000 points. Bitcoin doesn’t move in a vacuum, and the macro environment has been a consistent drag on risk assets. When bond yields fall, capital rotates back into equities and, increasingly, into crypto.
The RSI is telling a longer story than just the current move. The indicator line has broken through a two-and-a-half-year downtrend – a multi-year structure that, while it held, was capping the strength of any rally attempt. As long as the RSI line holds above that broken downtrend, the broader technical posture stays constructive. A slip back below it would change the interpretation considerably, shifting the momentum picture from recovery to something more uncertain.
Some voices in trading and investing circles maintain that the bear market isn’t finished. That’s a defensible view on a strict definition – and it serves as a useful reminder that narrative and price action don’t always align neatly. Markets can look bullish, feel bullish, and still deliver a final flush before committing to a new cycle. The $97,880 line is the number that resolves that debate, not sentiment.
What Has to Happen Next
Bitcoin is sitting inside a continuation pattern with a plausible bull case, a stubbornly intact uptrend, and a resistance level it has now tested multiple times without breaking. The rally has been orderly rather than parabolic, which is why overbought readings haven’t materialized. That restraint is either a sign of healthy accumulation – or a slow bleed of buying pressure that eventually runs dry.
The next candle close near $87,000 will carry more weight than most. A decisive close above that level with expanding volume would change the conversation entirely. A sharp rejection here – particularly one that undercuts the lower channel – would force a rethink of the entire short-term structure. The price is at the glass. Something breaks soon.
Comments are closed, but trackbacks and pingbacks are open.