
fomo Bridge Cuts Cross-Chain Swap Times Below One Second
A New Bridge, Built In-House
fomo began the public rollout of its own bridge on October 23, 2026, after a limited release to a small percentage of users the week prior. The infrastructure is entirely in-house – fomo built both the bridge and the router that directs trades between Solana and other chains, removing any dependency on third-party routing services. The company says cross-chain swaps on the app now complete in under one second, and claims its trades run up to 50% faster than existing solutions on the market.
The combination of proprietary bridge and proprietary router is what separates fomo’s architecture from competitors. Owning both layers means fomo controls latency and price on every step of a trade, not just one end of it. Most cross-chain apps own neither, or at most one – fomo says it is the only major trading app to control the full stack.

Route-by-Route: What the Numbers Show
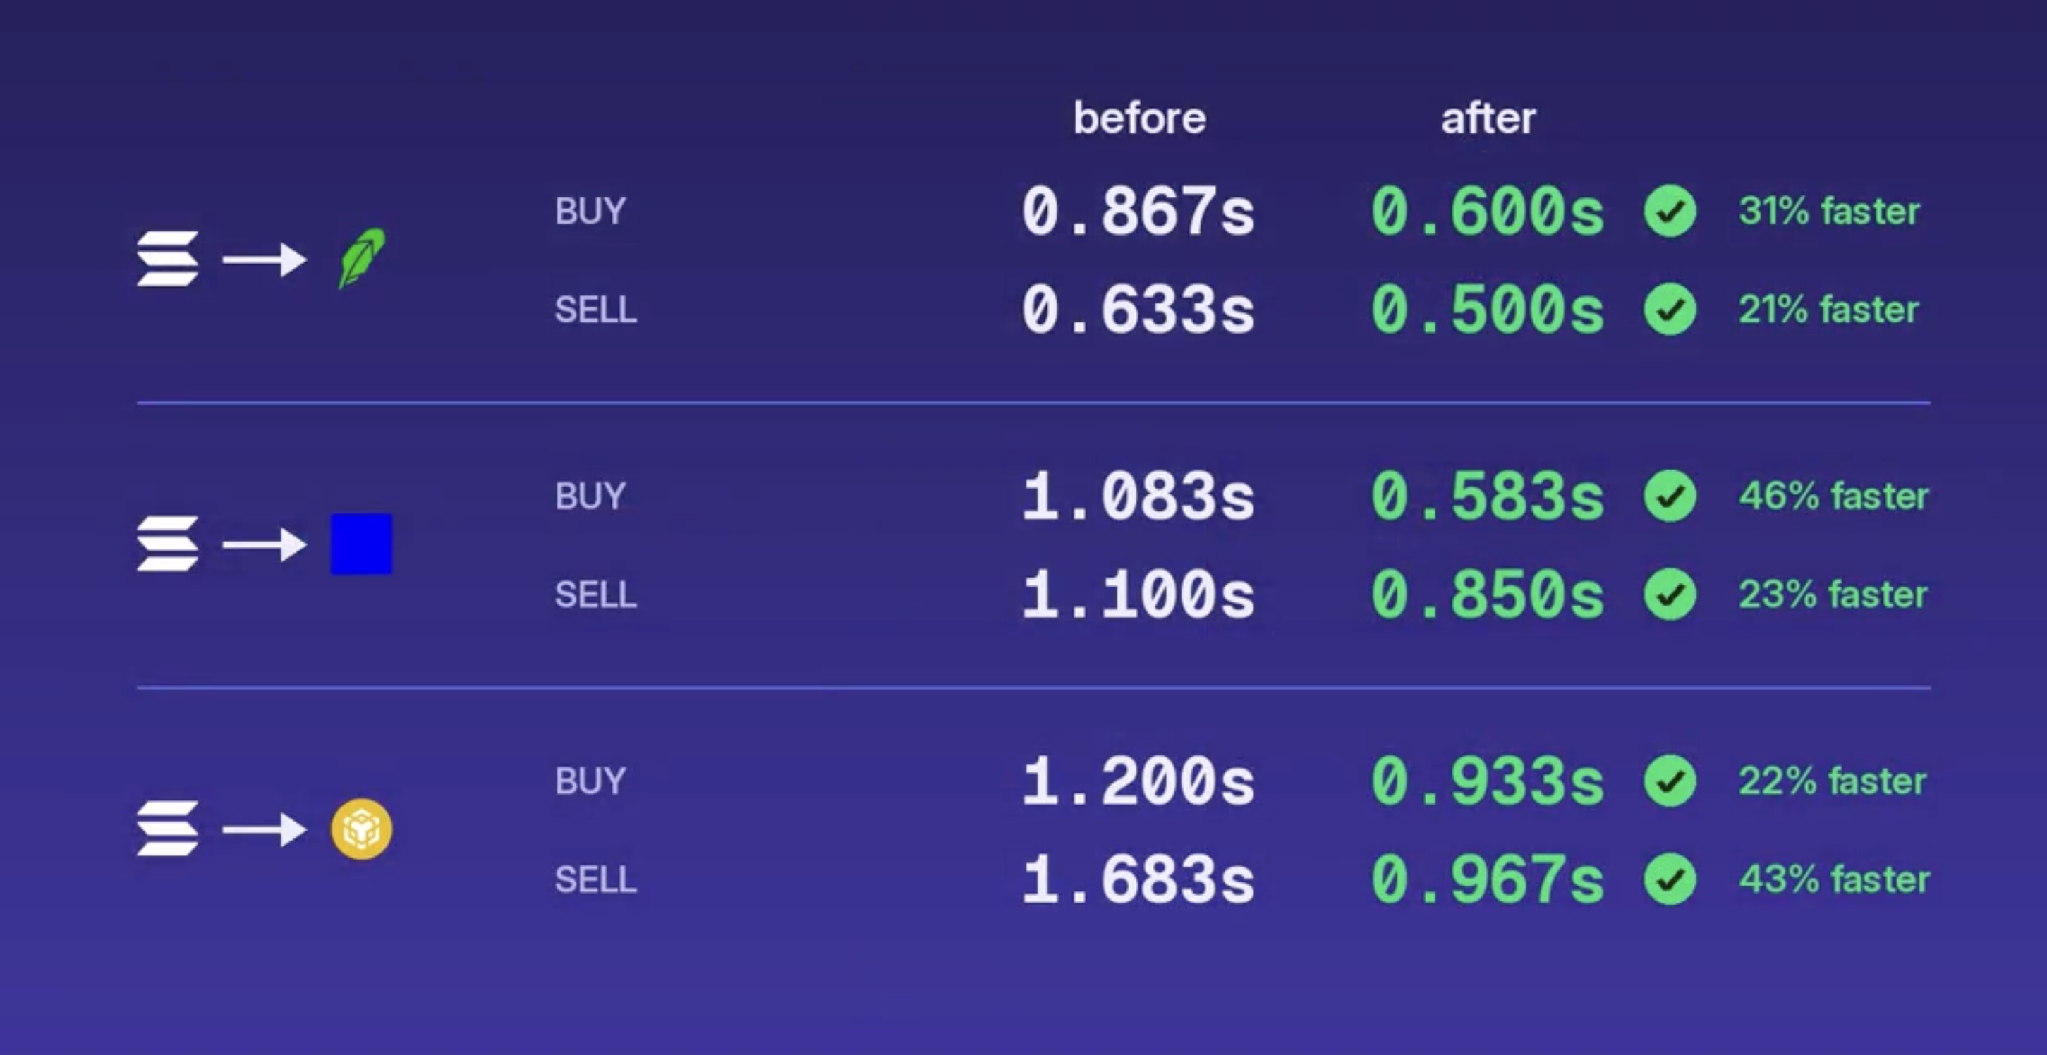
fomo published before-and-after figures for every active Solana route, and every single one got faster. The sharpest improvement came on buys to Base, which dropped from 1.083 seconds to 0.583 seconds – a 46% reduction. Sells to BNB Chain fell from 1.683 seconds to 0.967 seconds, a 43% cut. The Robinhood routes, which carry far more volume, improved too: buys fell 31% from 0.867s to 0.600s, and sells dropped 21% from 0.633s to 0.500s.
What stands out in the full table is that the slowest trade on the list – a BNB Chain sell – now finishes at 0.967 seconds. Before the bridge launched, it took 1.683 seconds. Every route fomo operates now clears in under a second, including the ones that historically lagged.
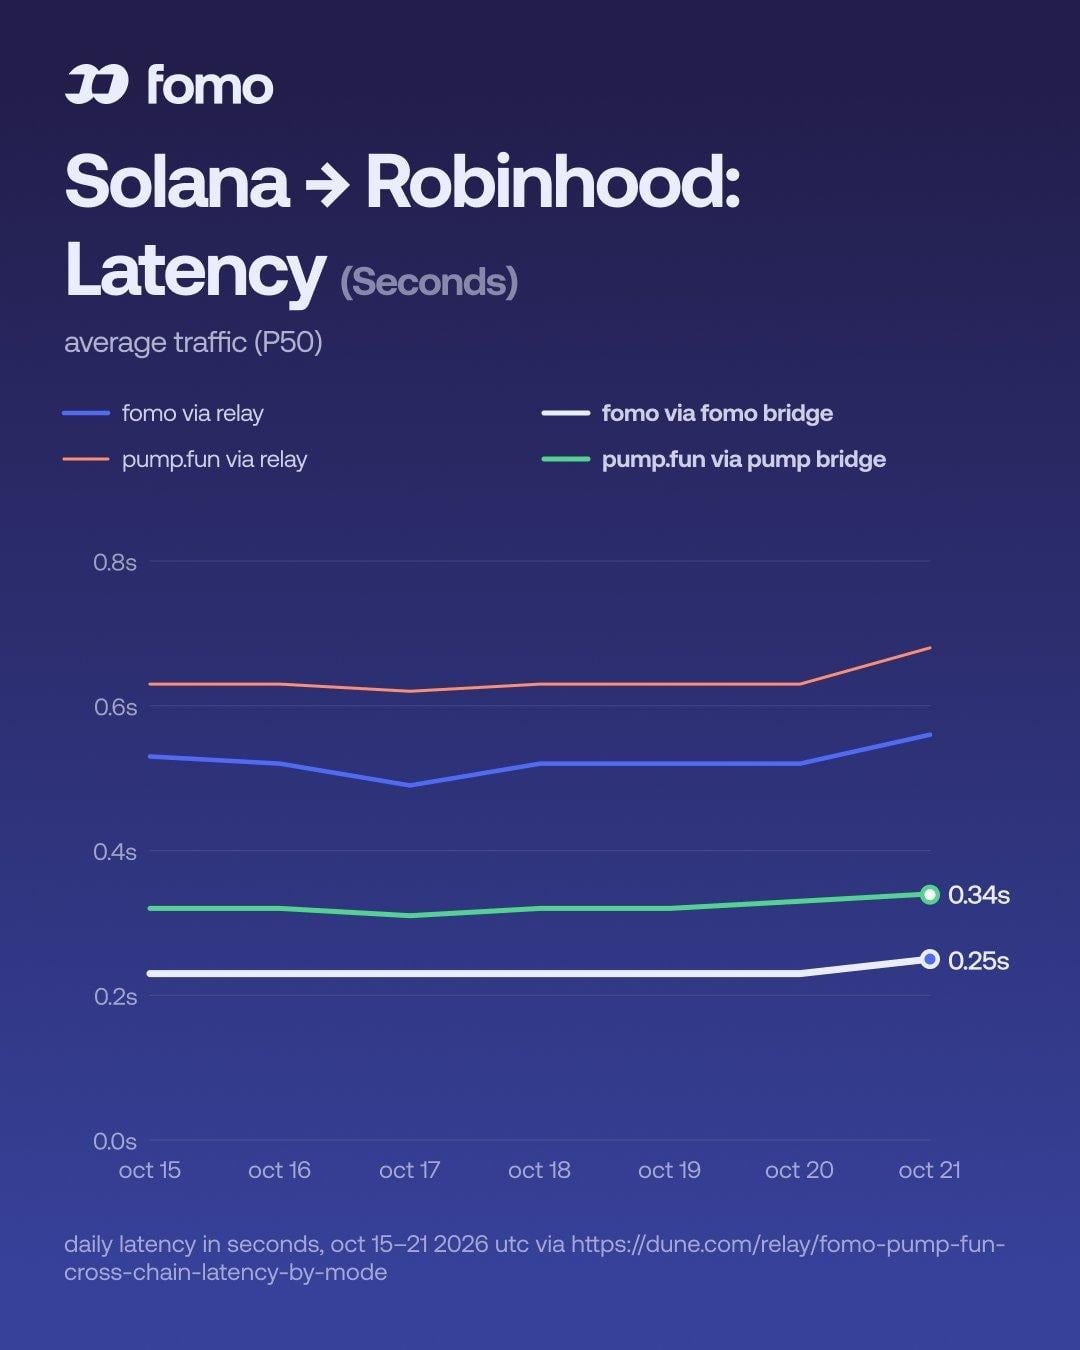
The comparison against pump.fun’s own bridge adds a second layer of context. Using Dune Analytics data for October 15 through 21, fomo bridge was the fastest option across all four Solana-to-Robinhood test configurations. At the median (P50), fomo completed a Solana-to-Robinhood swap in 0.25 seconds against pump bridge’s 0.34 seconds – a 26% lead. At the P90 level, which captures the slowest 10% of trades during normal conditions, fomo posted 0.46 seconds against pump bridge’s 0.71 seconds, a 35% margin.
The Robinhood-to-Solana direction showed even wider gaps. At P90, pump bridge slowed to 1.16 seconds – worse than either app’s Relay route. fomo bridge held at 0.70 seconds for the same test, staying under one second across every measurement taken during that week. Both apps’ Relay routes were slower still, ranging from roughly 0.55 seconds to 0.97 seconds across the same tests.
Volume at Scale: Where the Stress Test Really Happens
fomo reports handling more than 10 times the cross-chain transaction volume of any other trading app. On the Robinhood-Solana corridor alone, it processed approximately 4.27 million trades over 30 days, against roughly 439,000 for pump.fun. The Solana-to-Robinhood direction alone accounted for 2,395,891 trades for fomo versus 194,682 for pump.fun – a 12.3x lead. The reverse route, Robinhood-to-Solana, saw 1,872,192 fomo trades against 244,761 from pump.fun, a 7.6x difference.
Latency held up across that volume. Over 30 days, fomo’s median latency on Solana-to-Robinhood ranged between 0.23 and 0.56 seconds depending on the day. During high-traffic periods it stretched to between 0.43 and 0.97 seconds. fomo’s best single-day figures – a 0.23-second median and 0.43 seconds under load – both came on the Solana-to-Robinhood route. Pump.fun’s comparable 30-day range ran from 0.31 to 0.68 seconds at average traffic, and 0.54 to 0.83 seconds under load.
Speed Under Load and Price Quality at the Fill
fomo’s core argument is that average-traffic speed is a misleading benchmark for evaluating a trading platform. What matters is performance during volatility, when order flow spikes and every millisecond of latency translates into slippage or a missed entry. The P90 figures – which measure the slowest 10% of trades – are built for exactly that scenario. When pump bridge slowed past one second on the Robinhood-to-Solana direction during the test week, fomo bridge stayed at 0.70 seconds. For traders moving in and out of fast-moving tokens, the difference between 0.70 seconds and 1.16 seconds is often the gap between the price they targeted and the price they received.
Beyond speed, fomo claims its in-house router delivers fill quality that is 0.5% better on average than competing routers, and improves the worst 10% of trades by more than 2%. To illustrate why that compounds, fomo uses a simple model: assume a 2% execution cost on every trade. After 100 trades, 0.98 raised to the power of 100 leaves 13.3% of the starting balance – an 86.7% loss attributable entirely to friction. The implication is that small, recurring gaps in execution quality are not small over time.
fomo now owns the full trade path – bridge and router – on every cross-chain transaction it processes. With 4.27 million trades run in a single month on one corridor, the question is whether that architecture holds as volume continues to climb, and whether pump.fun responds by accelerating development of its own bridge to close a gap that currently sits at 40% in the worst-case tests.
Comments are closed, but trackbacks and pingbacks are open.