
Bitcoin Stalls at $87,400 With $89,250 Resistance Directly Overhead
A Sharp Rally Hits a Natural Ceiling
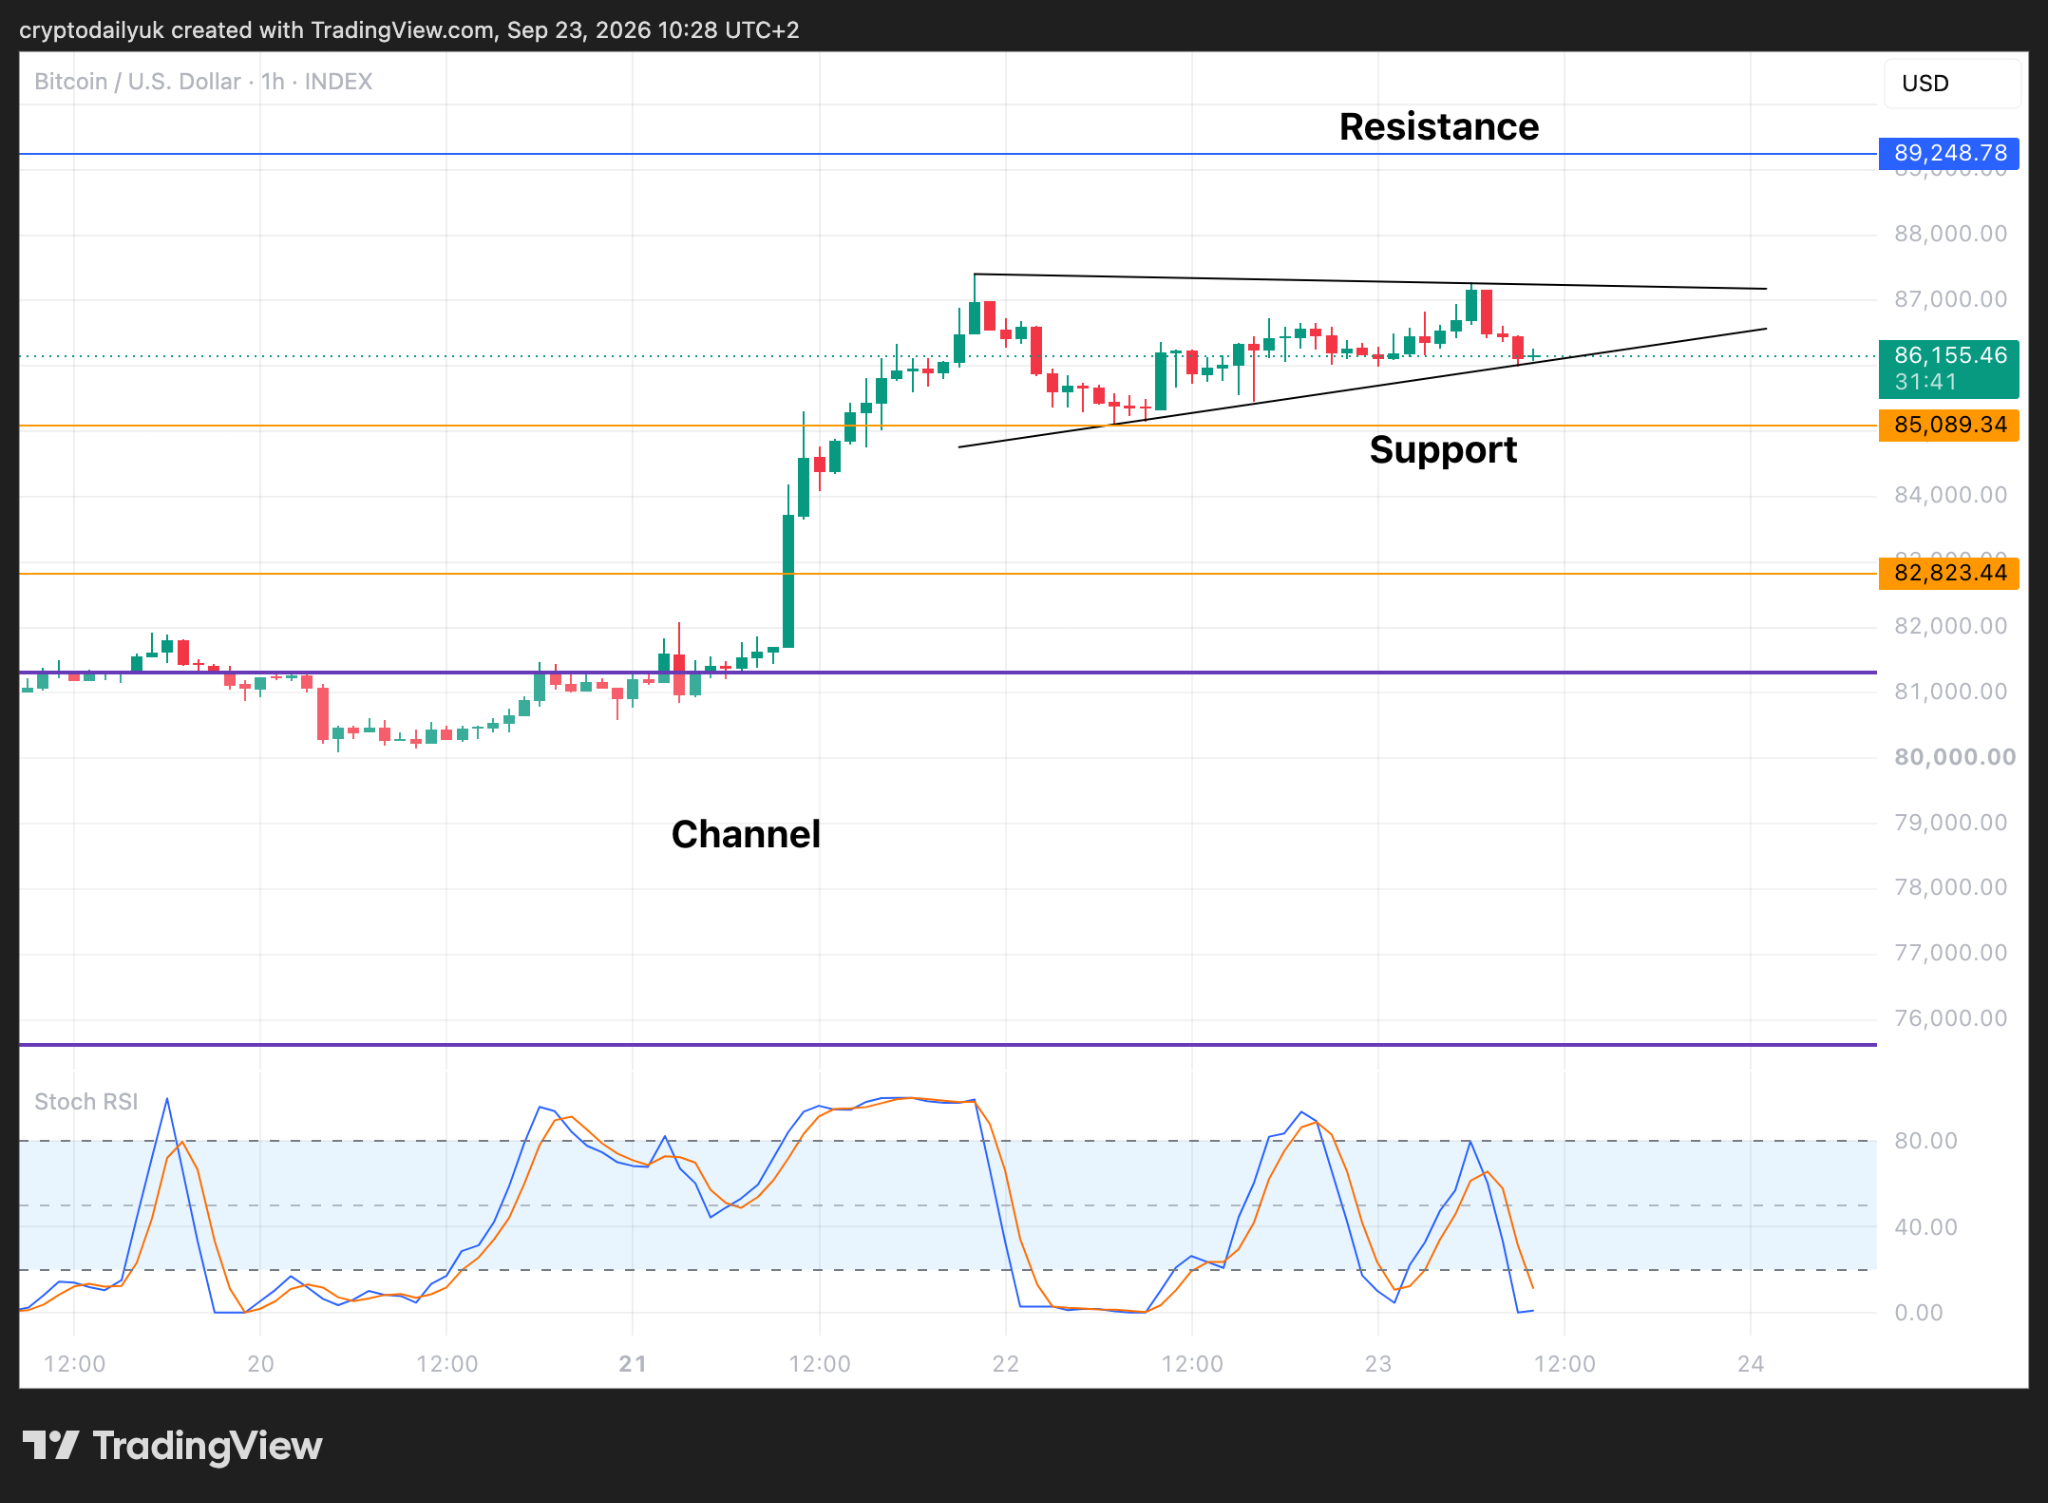
Bitcoin climbed 7.5% in a swift move that carried the price from $81,300 – the upper boundary of a parallel channel – to a local top at $87,400, a gain of $6,100. That burst of momentum has since given way to sideways trading, with price action narrowing into a tightening range as buyers and sellers negotiate the next direction.
The structure forming on the 1-hour chart fits the profile of a bull pennant: a strong directional move followed by a contracting consolidation as volatility compresses. Whether that label holds depends on what comes next. A breakdown from here would reshape it into a standard flag with parallel trendlines rather than converging ones, which carries different implications for where price ultimately resolves.

What the Pennant Is Actually Saying
In technical terms, a pennant following a sharp upward thrust is treated as a continuation signal – the pause before the next leg higher. The Stochastic RSI on the 1-hour chart is currently pressed against its lower boundary, a condition that has historically preceded upside bounces. If that dynamic plays out again, Bitcoin would push back toward the top of the pennant structure and then face a clean decision point: break above it, or reject and fall.
The immediate target for any breakout sits at $89,250. That level is not arbitrary. It traces back to the middle band of Bear Flag 1 from the prior bear market cycle, where price repeatedly used that zone as both support and resistance across multiple touches. Levels with that kind of history don’t disappear – they become embedded reference points that traders continue to respect in future cycles.
Bear Market Ghosts Are Still Setting the Map
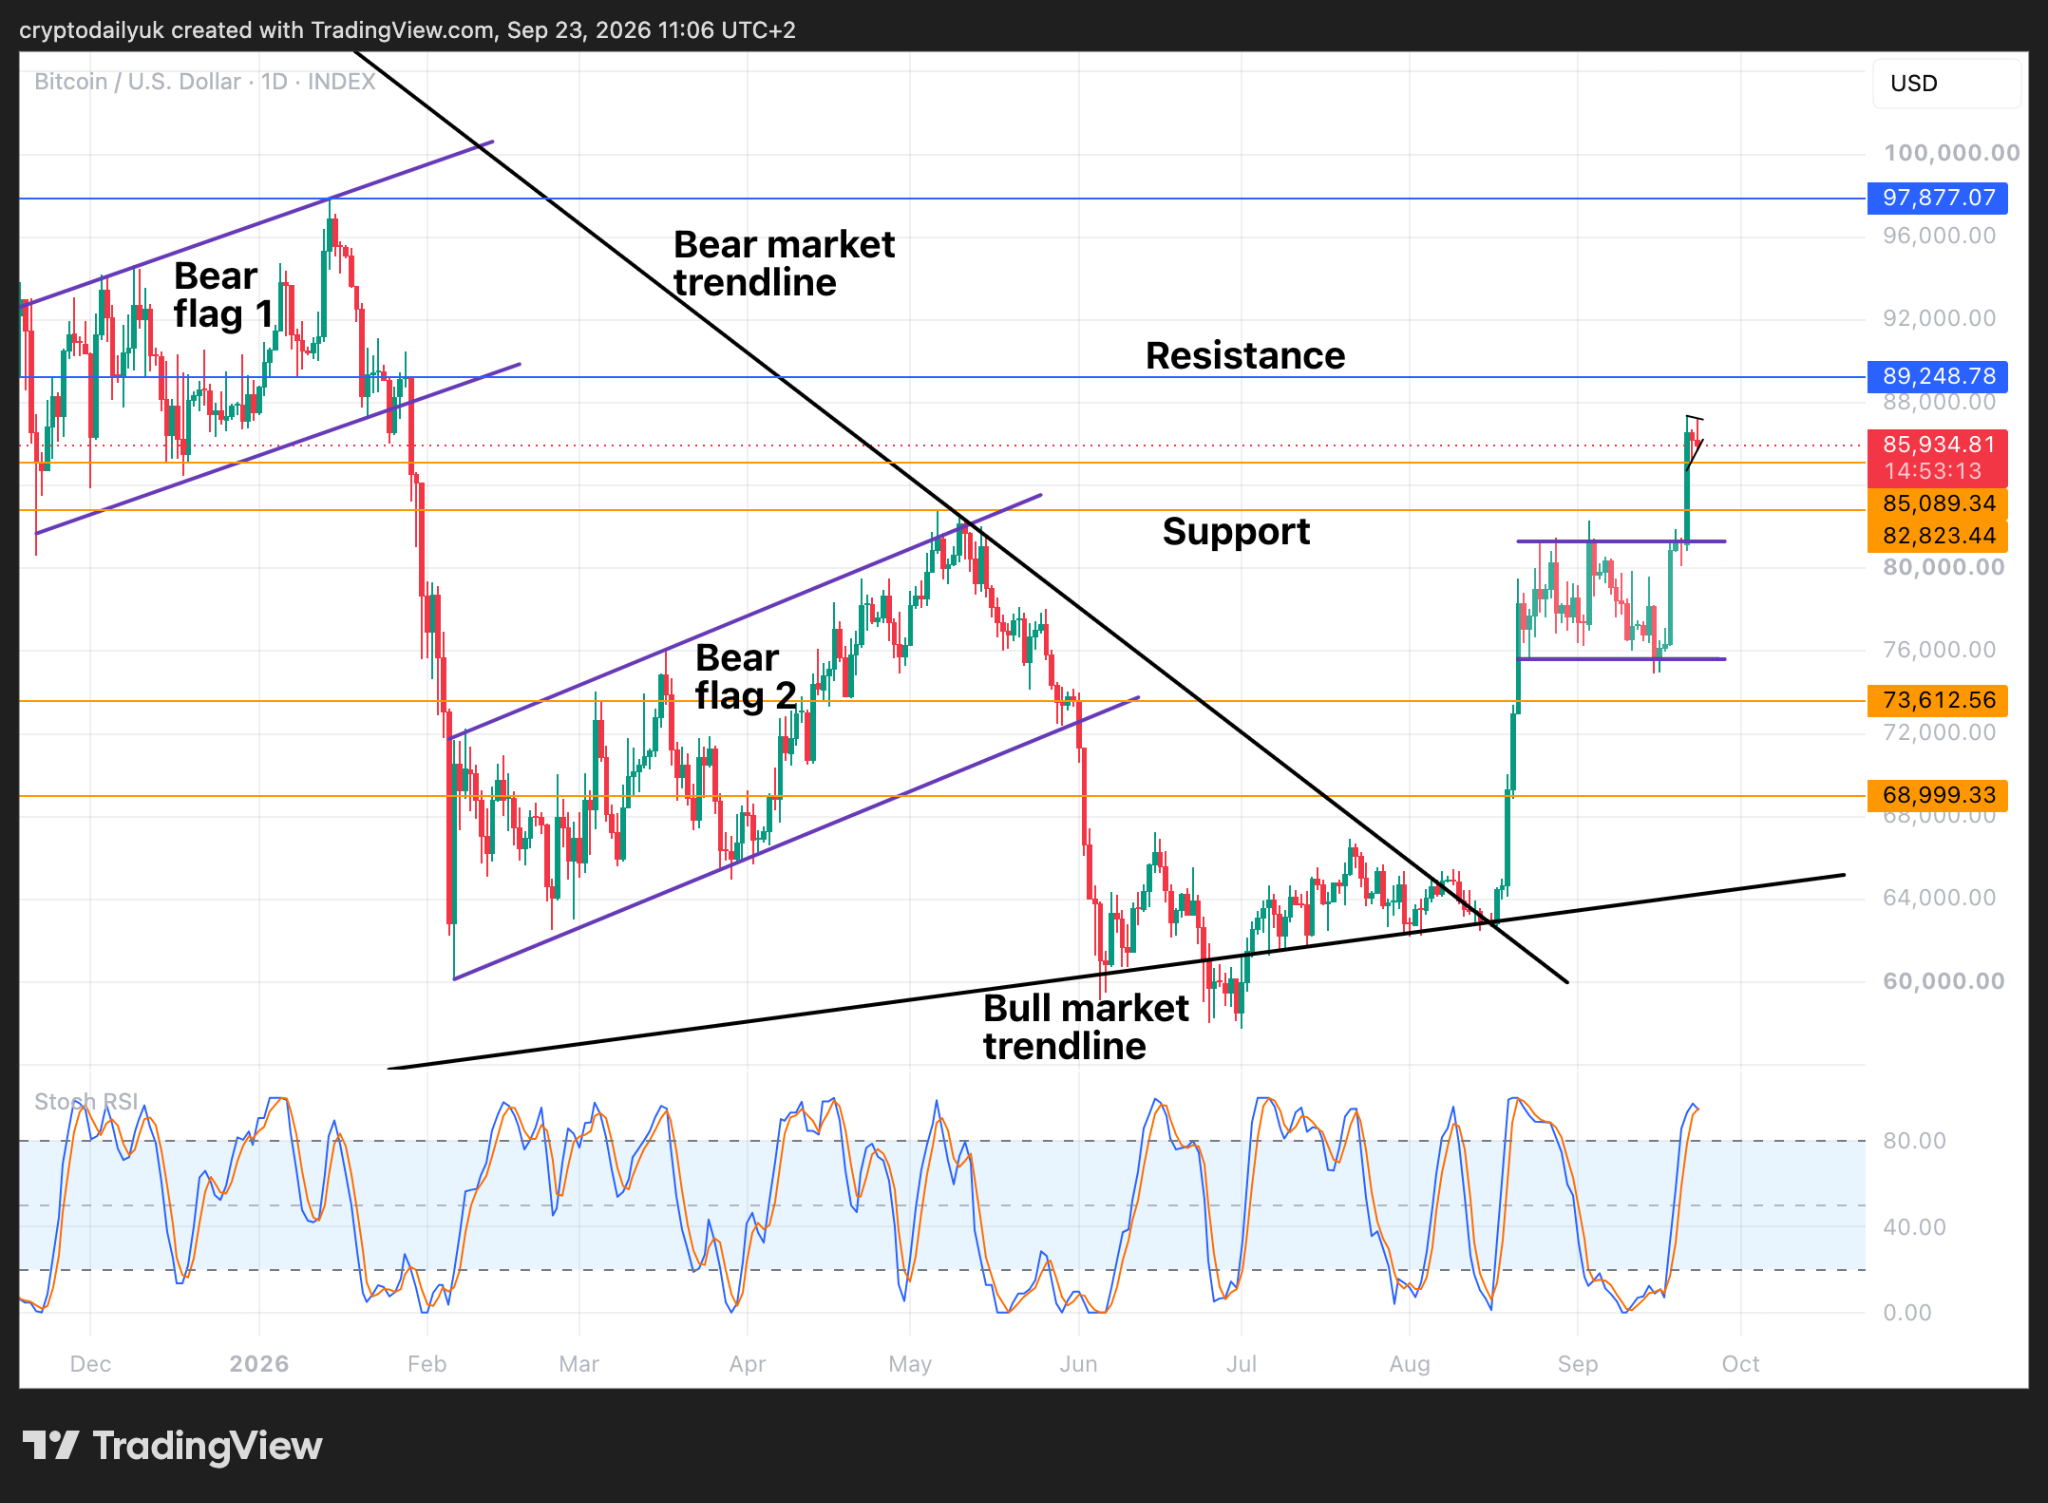
The daily chart tells a broader story. On the left side sits the bear market structure – a series of bear flags that defined the downtrend. Those formations left behind support and resistance lines that are still active. Bear Flag 2’s upper boundary, sitting at $82,820, was the higher high that Bitcoin recently cleared. Breaking above that level was significant: it was one of the conditions needed to formally shift the trend structure from bearish to bullish.
That $82,820 level now functions as a potential retest target if Bitcoin pulls back more aggressively than the current consolidation suggests. A retest of that zone – and a hold above it – would convert the level from resistance to confirmed support, which is a standard technical process for trend validation. Until that confirmation arrives, it remains a level to watch rather than one to rely on.
Above the current price, three resistance levels stand out as likely stopping points for this rally: $89,250, $93,500, and $97,900. The progression suggests a staircase structure rather than a straight shot to any single target. Each level represents a point where sellers from the previous bear cycle entered the market, and each will need to be worked through before Bitcoin can establish clean ground above it.
There is also a scenario where Bitcoin doesn’t charge straight at $89,250 but instead consolidates deeper first, pulling down to retest $85,000 before resuming. That kind of shallower retracement would keep the bullish structure intact while giving late buyers a secondary entry. Both paths remain open for now, and the pennant’s resolution will likely determine which one plays out in the near term.
The RSI Is Doing Something That Hasn’t Happened in Two and a Half Years
On the daily RSI, a descending trendline that had been in place for roughly two and a half years was recently broken to the upside. That trendline had been suppressing momentum readings throughout the bear market, capping each recovery attempt. Its breach is one of the cleaner signals available that market momentum has shifted at a structural level.
In a genuine bull market environment, the expectation is that the RSI indicator line begins registering higher highs – and that it does not fall back below the broken trendline. A return below that trendline would undermine the current reading and suggest the break was a false signal rather than a structural change. That test hasn’t come yet, but it will at some point during the next meaningful pullback.
The Rally Will Eventually Find Its Ceiling
Sharp rallies like this one carry their own consequences. The steeper the ascent, the longer the market typically spends digesting it afterward. A temporary top will form somewhere in the $89,250-to-$97,900 range, and when it does, a significant retracement period will follow before any further upside can develop. That retracement isn’t a failure of the bull case – it’s a mechanical requirement of how sustained uptrends actually build.
What matters for the short term is whether the pennant on the 1-hour chart resolves higher or breaks down. A clean upside breakout from the current structure keeps $89,250 as the immediate target and puts the broader resistance map firmly in play. A failure here, however, raises the question of whether the rally has already exhausted its first major phase – and whether Bitcoin needs to spend considerably more time at lower levels before another attempt at $90,000 becomes viable.
Bitcoin has now cleared the higher high from Bear Flag 2, broken a multi-year RSI trendline, and is pressing against resistance that dates to some of the most active trading zones of the prior bear market. The next 48 to 72 hours inside this pennant structure may determine whether $90,000 is the next stop – or just the next headline that doesn’t quite get reached.
Comments are closed, but trackbacks and pingbacks are open.