
Bitcoin rising channel could guide price to $100K
An Ascending Channel Takes Shape Across All Timeframes
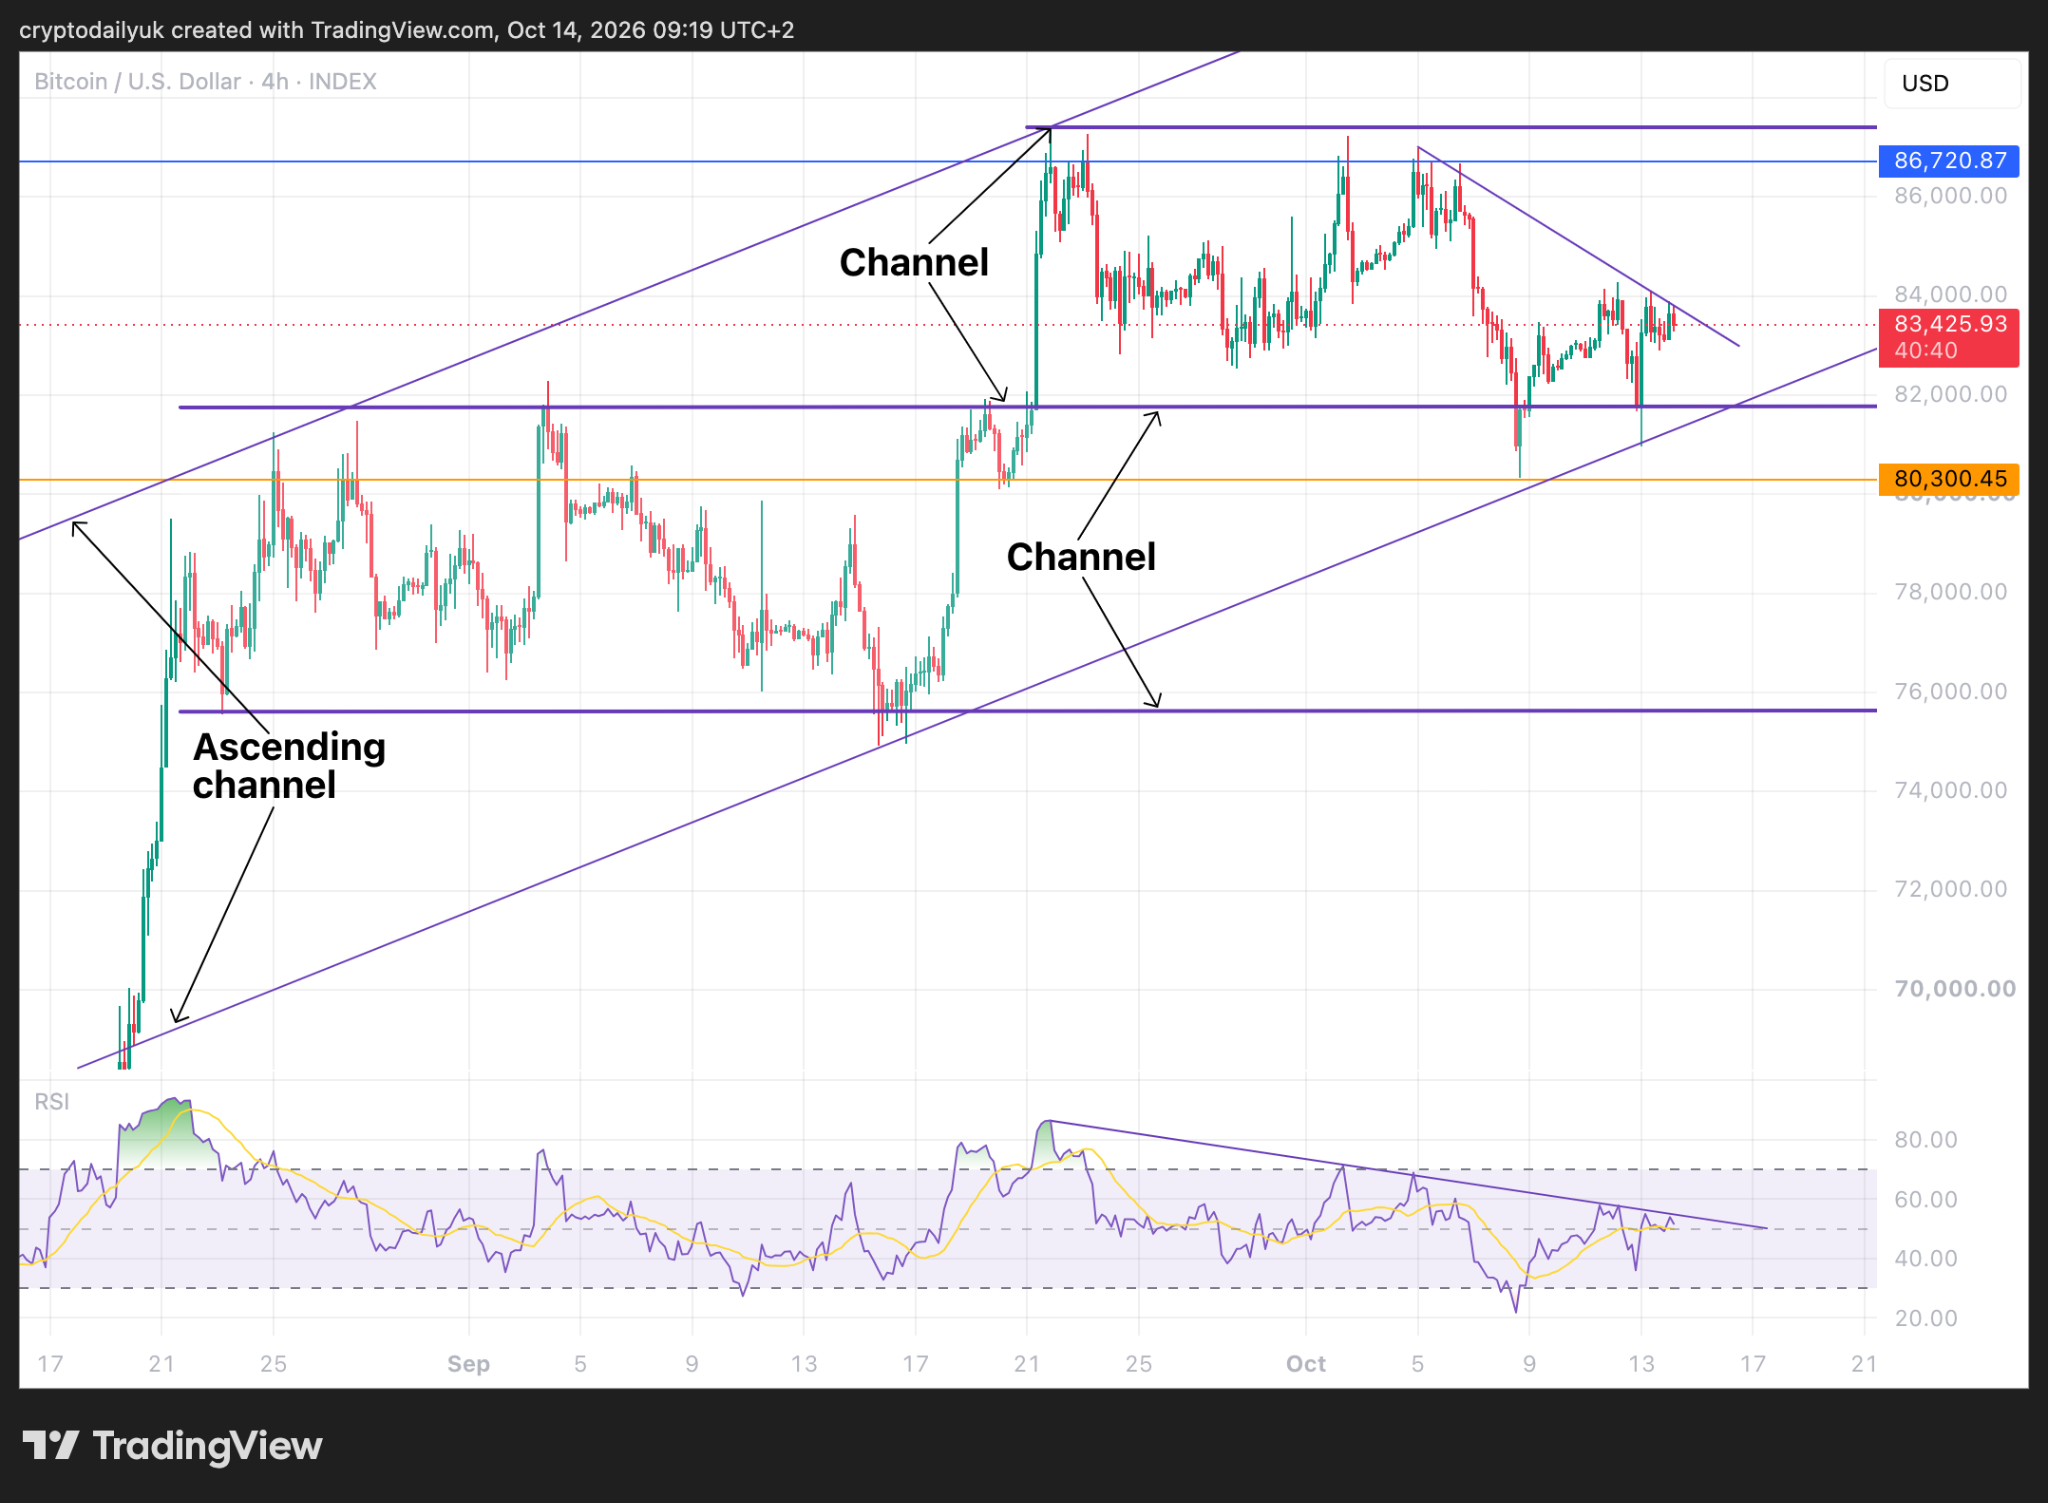
Bitcoin has been tracing out a broad ascending channel that now contains the entirety of its recent price action – a structure that, if it holds, points toward a return to the $100,000 level. What began as two overlapping parallel channels since August, each one sitting on top of the other in a way that looked disorganized and difficult to trade, has resolved into a single, cleaner ascending channel that better captures the underlying pattern. The question is whether buyers can defend the lower boundary before momentum tilts decisively to the downside.
The pattern still needs work before it can be called confirmed.
The top of the channel has been touched only twice so far. Technical patterns typically require three contact points at each boundary to carry real weight, meaning the channel’s upper rail remains tentative. At the same time, Bitcoin’s price is sitting close to the bottom trendline – the exact zone where a failure to hold would not simply end the immediate trade setup but potentially open a path toward the low $70,000s. How the price behaves at this level over the coming sessions may define the next several weeks of market direction.

Short-Term Structure: A Small Trendline, a Big Consequence
On shorter timeframes, there is a minor descending trendline that Bitcoin needs to break above. A successful breach of that line would put the $86,720 resistance level back in play. That price point carries more significance than it might appear – it is the level where tops of recent weekly candle bodies have been closing, and it served as support throughout the first major bear flag of the broader bear market before price broke lower. Getting above $86,720 in a sustained way would constitute the first higher high after a sequence of lower lows, a structural shift that technical traders treat as an early signal of trend reversal.
The Relative Strength Index on the shorter chart is showing a descending trendline of its own, with the RSI line sitting just beneath it. A break above that RSI trendline has historically corresponded with upward movement in price action, making it a secondary confirmation traders are watching alongside the price trendline itself. Both would need to resolve to the upside together to give the bullish case real credibility.
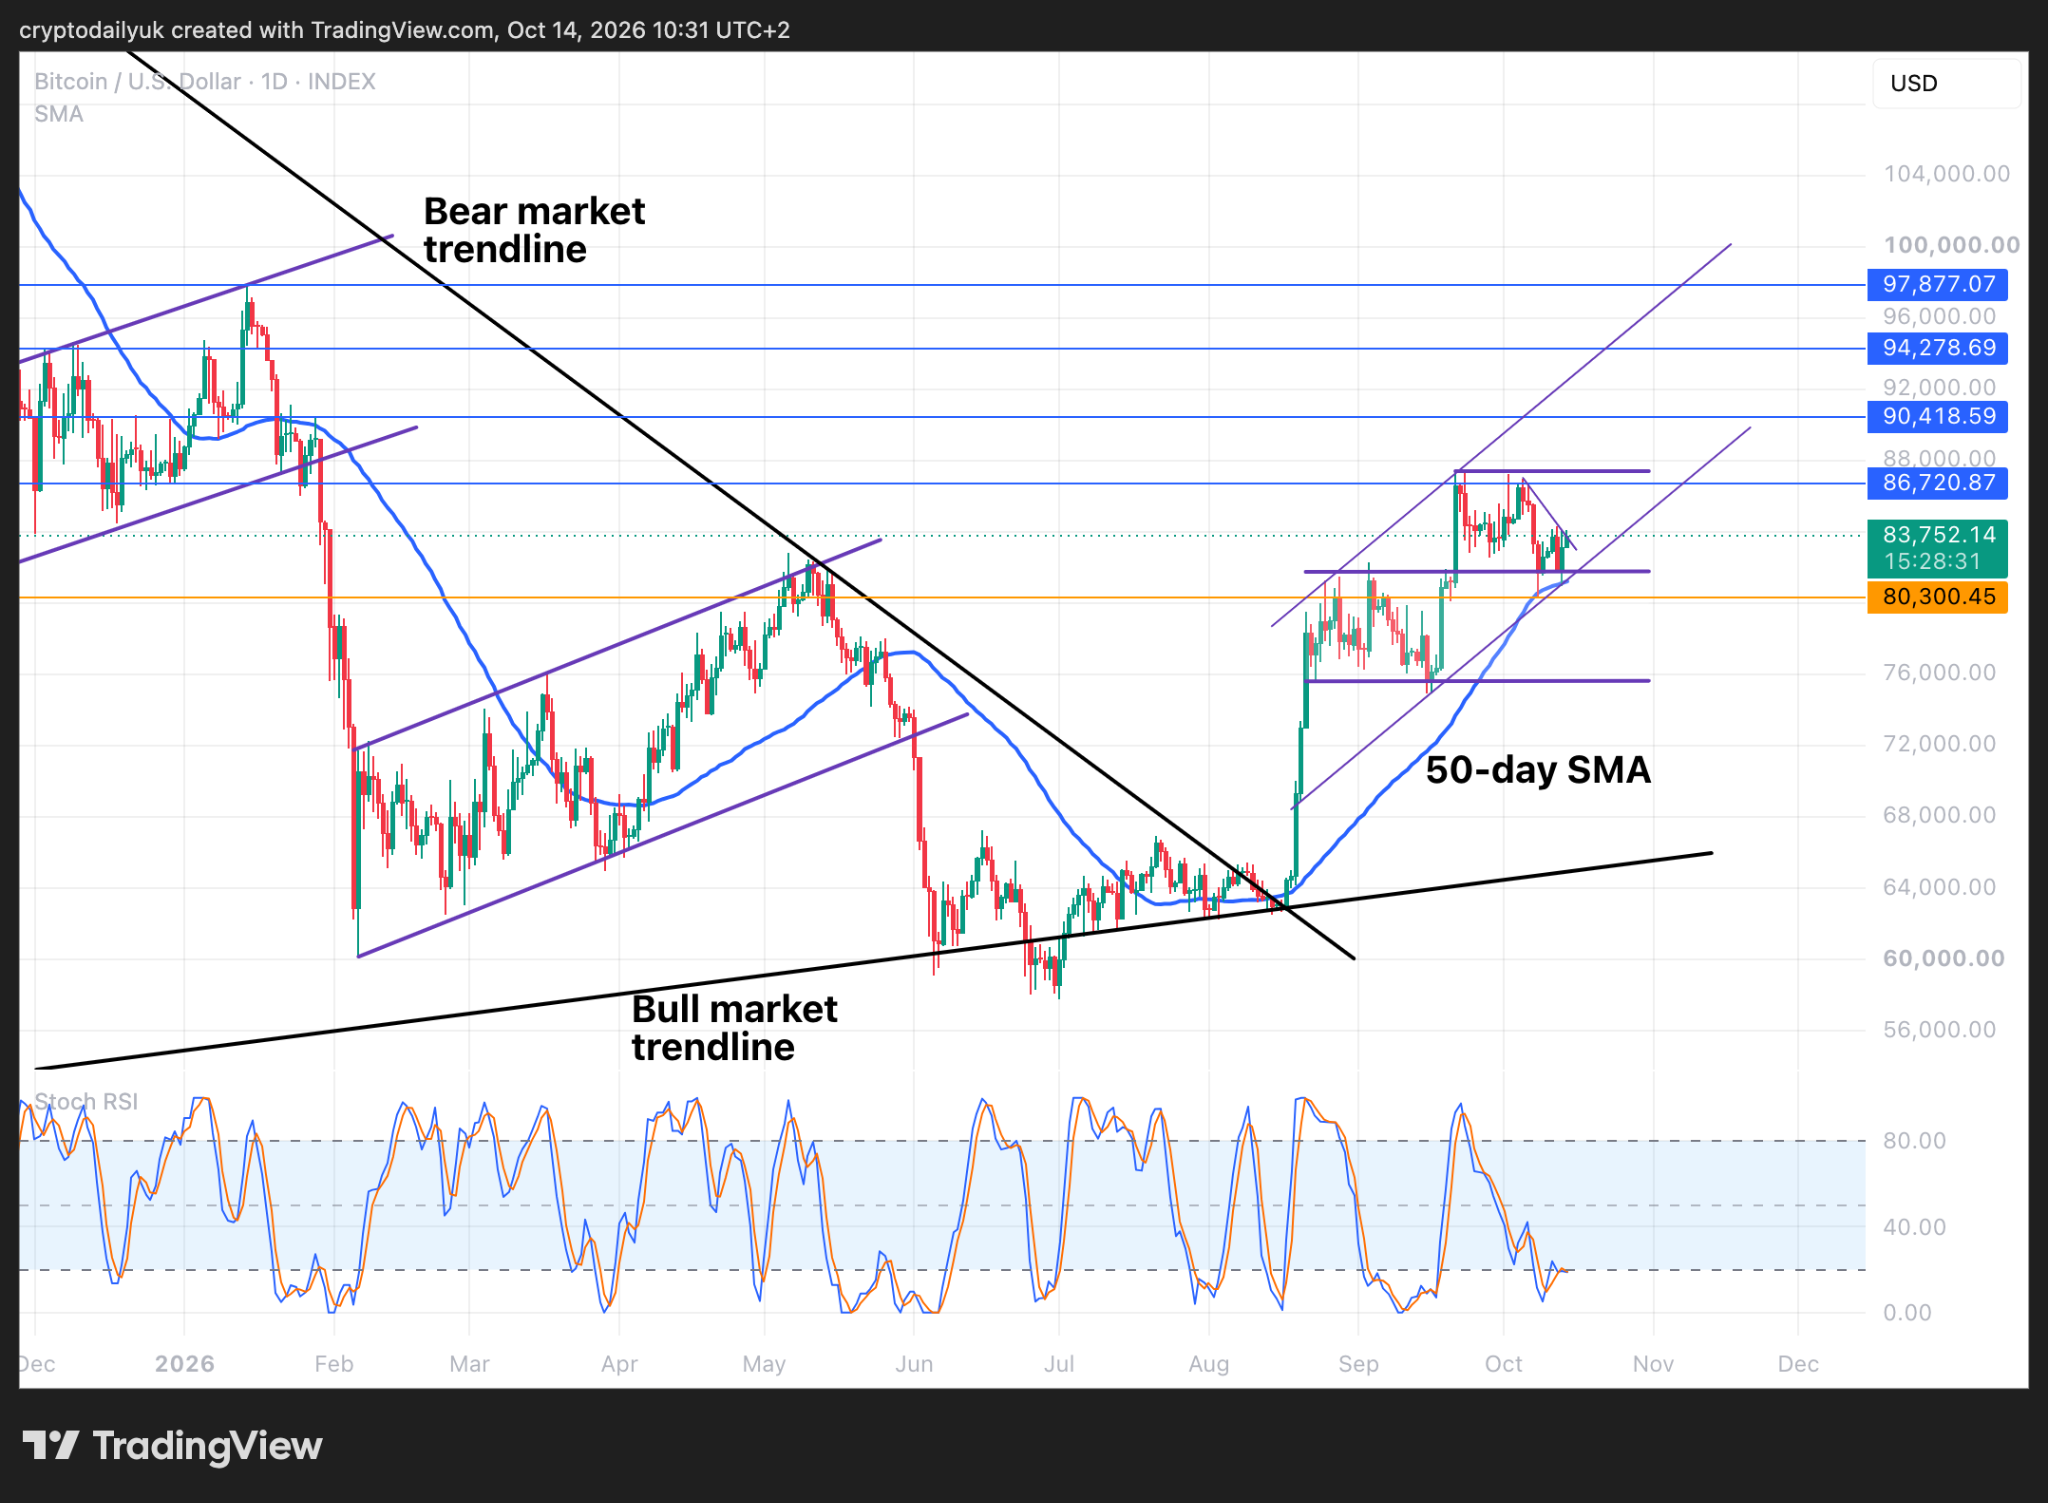
The 50-day simple moving average has acted as support on two separate occasions, with Bitcoin bouncing from that level each time price pulled back to test it. That moving average needs to maintain its upward angle to stay relevant within the channel’s lower boundary. If the 50-day SMA begins to flatten or roll downward, it would signal that the underlying trend is already deteriorating – a warning sign that tends to arrive slightly before a full breakdown becomes obvious in price alone.
Weekly Signals Are Flashing Caution
Zooming out to the weekly timeframe, the picture becomes more complicated for anyone positioned long. The Stochastic RSI has crossed down from the very top of its range. Unless that indicator finds a bounce at the 80.00 level, this reading is bearish. The MACD adds to the concern: the blue signal line appears to be flattening, and the histogram has printed two consecutive smaller green columns – a sign that buying momentum is decelerating even if it has not yet reversed. These are not individually decisive signals, but their simultaneous appearance across the weekly chart is difficult to dismiss.
The $86,720 level explains a great deal about why Bitcoin has stalled here. During the earlier phase of the bear market, that price acted as support for an extended period before the first significant drop. Now it is functioning as resistance, with weekly candle bodies closing just beneath it repeatedly. Price memory at key horizontal levels tends to be sticky, and the market has not yet found the volume or the catalyst to push through it cleanly.
After the magnitude of the rally that brought Bitcoin to this point over recent weeks, a correction is a reasonable expectation regardless of the channel structure. Strong rallies rarely continue without a shakeout, and the combination of the Stochastic RSI cross-down, a potentially topping MACD, and the failure so far to clear $86,720 suggests that any correction – if it arrives – could be meaningful in size. A drop toward $70,000 is the target area cited if the ascending channel’s lower trendline breaks and holds beneath that boundary.
What Happens at the Channel Floor
The ascending channel remains intact as of now, and the bullish case is not closed. Bitcoin has recovered from bearish indicator readings before, and the 50-day SMA support bounces demonstrate that buyers are still present and active at technically significant levels. A weekly close above $86,720 would reframe the entire setup and put the path toward $100,000 back at the center of the conversation. But the bears have their own argument: momentum indicators across multiple timeframes are weakening at precisely the level where prior structure gave way, and the channel’s lower trendline has not been definitively defended yet.
If Bitcoin’s lower channel trendline breaks and closes below, the $70,000 range becomes the next area of technical interest – and the rally that defined the past several weeks would be categorized, in hindsight, as a failed attempt to reclaim higher ground rather than the beginning of a new leg up.
Comments are closed, but trackbacks and pingbacks are open.